Woodies CCI
Oscillators
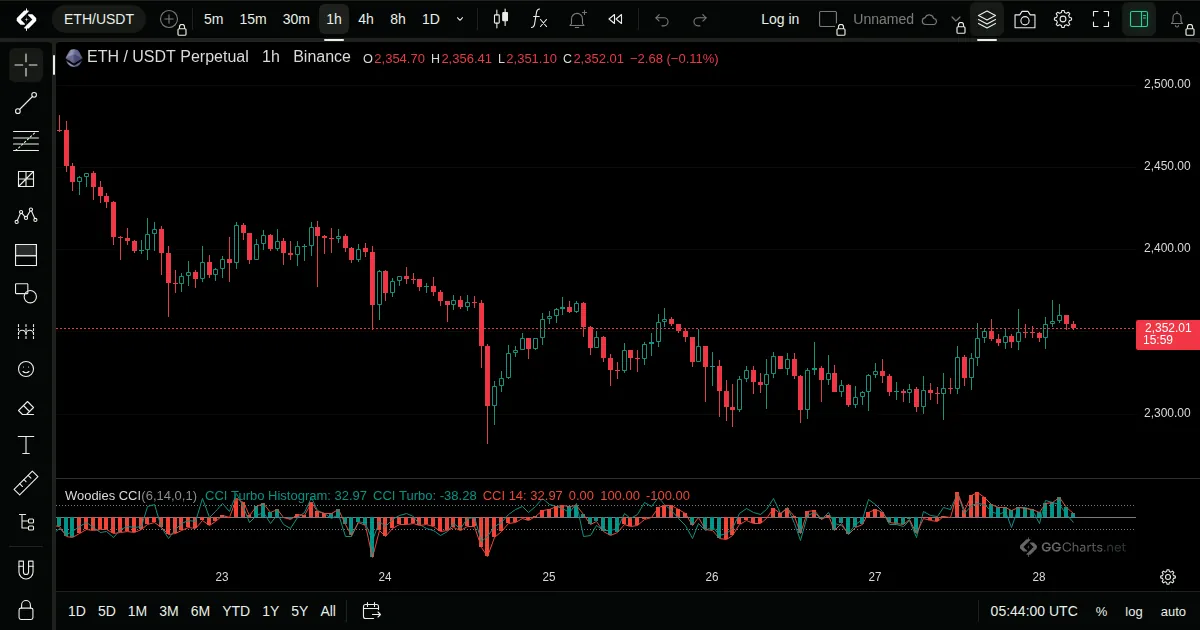
- What it shows
Two Commodity Channel Index lines of different speed, a fast one and a slower one, shown in one pane.
- How it is built
A short and a 14 period CCI are drawn together and coloured by their sign.
Default: Turbo CCI 6, CCI 14.
- How traders read it
- The slower line gives the trend, the fast line the timing.
- Crossing zero changes the colour.
- Extremes beyond 100 are stretched moves.
Related indicators
Rank Correlation IndexRCI RibbonChop ZoneStochastic Momentum Index
SMI Ergodic Oscillator← All indicatorsRank Correlation Index