Charts
Any symbol on 14 exchanges and Hyperliquid HIP-3, with candles and prices from the exchange you picked. In the browser on desktop and on the phone.
One session
What a few minutes with the chart look like. All three work without a log in, and the clips are the live chart.
Open the market
Search a symbol and pick the exchange and the market type. The chart keeps both: an OKX perpetual stays an OKX perpetual.
Mark it up
Draw a trend line or a Fib, then drag its points to adjust. 84 tools in all.
Add what you read
Any of 113 indicators, with its inputs, colour, opacity and line style changed in its settings. GG-Osc is on Premium.
What the chart does
- 12 timeframes
- 1m, 3m, 5m, 15m, 30m, 1h, 2h, 4h, 8h, 12h, 1D, 1W.
- 5 chart types
- Candles, hollow candles, bars, line and Heikin Ashi.
- Scales
- Auto, logarithmic and percent.
- Date ranges
- 1D, 5D, 1M, 3M, 6M, YTD, 1Y, 5Y and All in one tap.
- Watchlist
- Symbols from any exchange in one list.
- Compare
- Put another symbol on the same chart.
- Save image
- A picture of the chart in one click.
- Gestures
- Pan and zoom with the mouse, trackpad or fingers.
- Without a log in
- Any market, timeframe, drawing tool, the built-in indicators and Replay. Alerts, layouts, GG-Shøt, GG-Osc and the assistant need a Telegram log in.
How far back
The chart loads the history each exchange publishes for that market and timeframe. Young markets have a short history, and some exchanges keep less of the smallest timeframes. All in the date ranges means all the history the exchange gives.
Every bar in detail
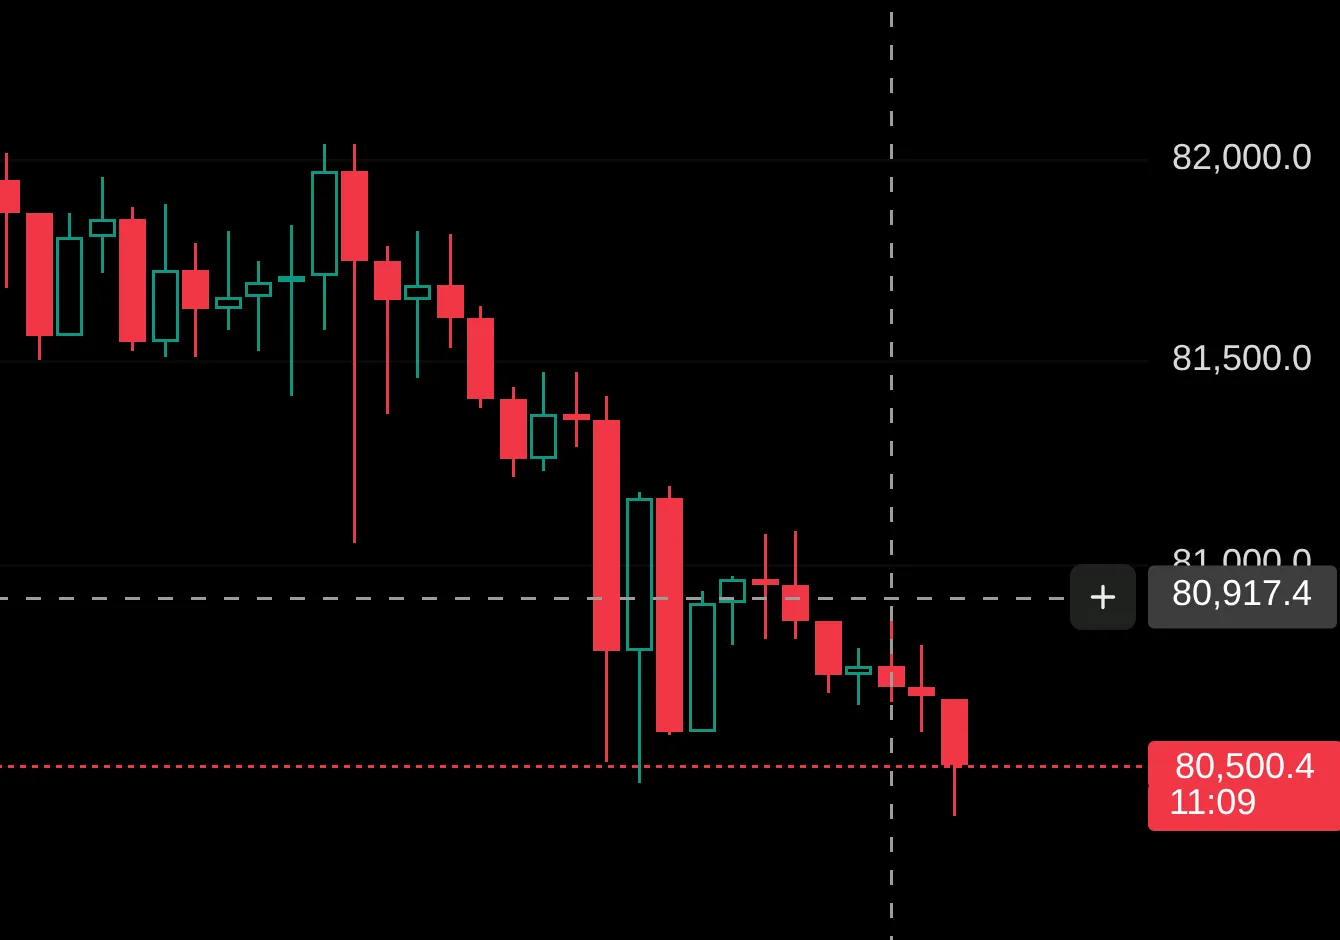
The crosshair, the price on the scale and the time to the bar close.
Per plan
| Feature | Free | Pro | Premium |
|---|---|---|---|
| All coins, timeframes and exchanges | Yes | Yes | Yes |
| Charts per screen | 2 | 4 | 8 |
| Indicators per chart | 5 | Unlimited | Unlimited |
| Cloud layouts | 1 | 10 | 10 |
| AI assistant on the chart | No | Yes | Yes |
| No watermark | No | No | Yes |