Chop Zone
Oscillators
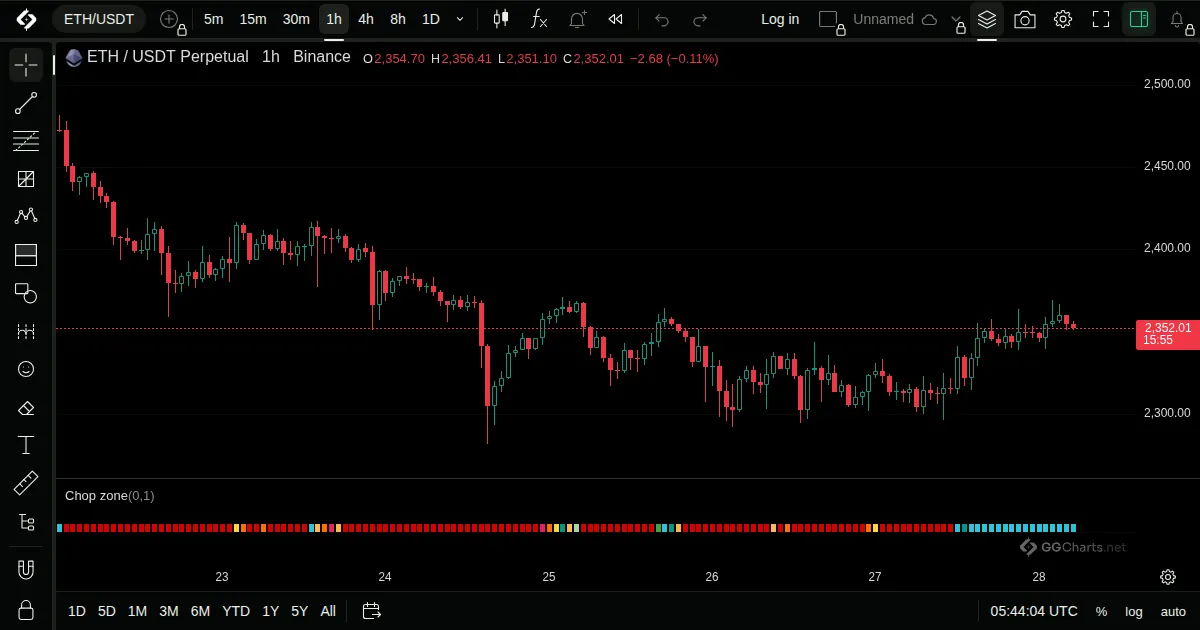
- What it shows
Colours the bars by the angle of the trend, so you can see at a glance if the market is flat or running.
- How it is built
It measures the slope of an EMA and sets a colour for each strength of the slope.
Default: No inputs.
- How traders read it
- Green tones: an uptrend of rising strength.
- Red tones: a downtrend.
- Yellow and orange: a flat market.
Related indicators
Stochastic Momentum IndexPrice Momentum OscillatorTrend Strength IndexPring's Special K