RCI Ribbon
Oscillators
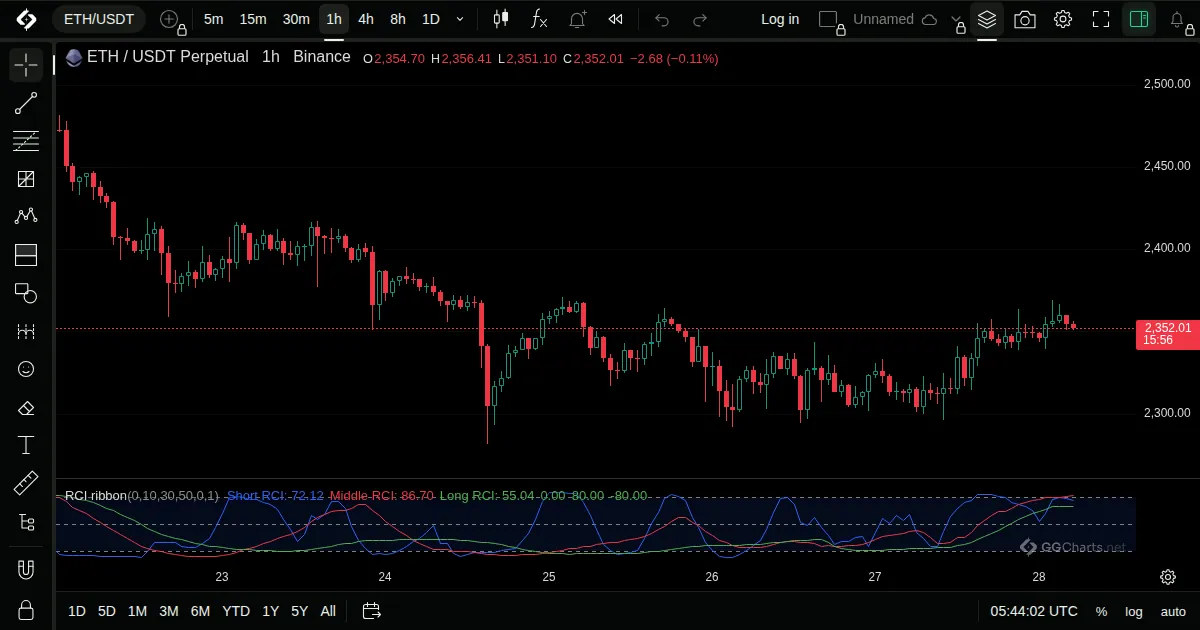
- What it shows
Three Rank Correlation lines of short, middle and long length drawn together as a ribbon.
- How it is built
RCI is calculated for three periods and plotted in one pane.
Default: Short 10, middle 30, long 50.
- How traders read it
- Lines moving together show a clear trend.
- A short line that turns before the others shows a possible reversal.
- Tangled lines show a range.
Related indicators
Chop ZoneStochastic Momentum IndexPrice Momentum OscillatorTrend Strength Index