Rank Correlation Index
Oscillators, RCI
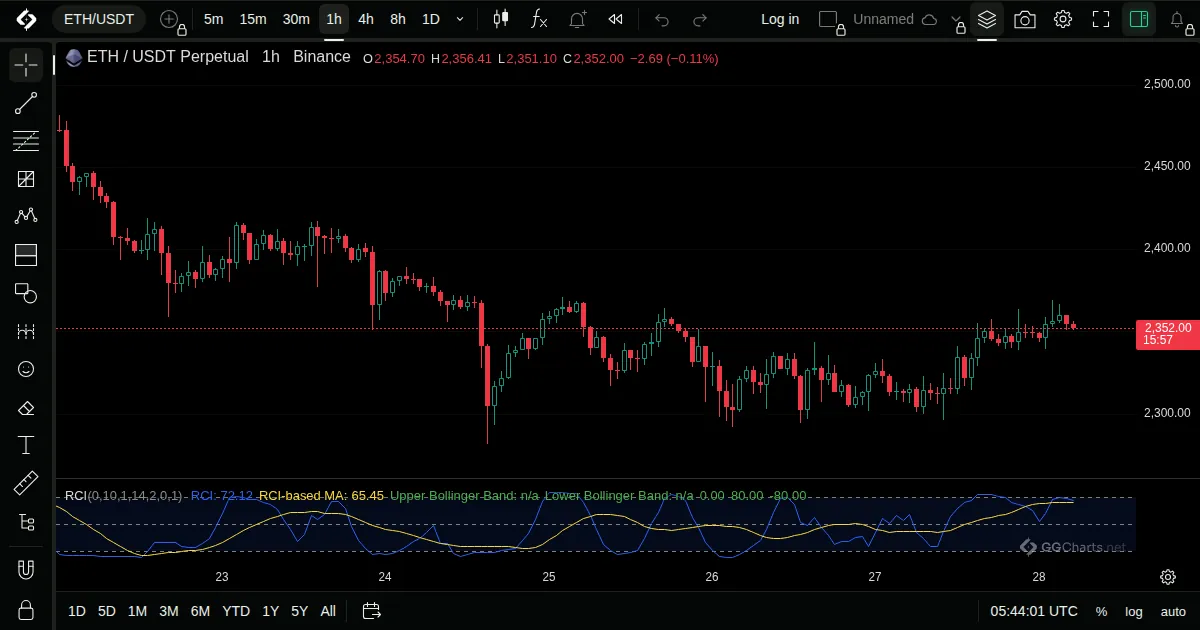
- What it shows
Compares the order of prices with the order of time over the period, on a scale from -100 to 100.
- How it is built
It ranks the closes of the period and measures how closely that rank follows the time order.
Default: Length 10, source close.
- How traders read it
- Near 100: price is rising steadily.
- Near -100: price is falling steadily.
- Crossings of the extremes show turns.
Related indicators
RCI RibbonChop ZoneStochastic Momentum IndexPrice Momentum Oscillator