Stochastic Momentum Index
Oscillators, Stoch MI
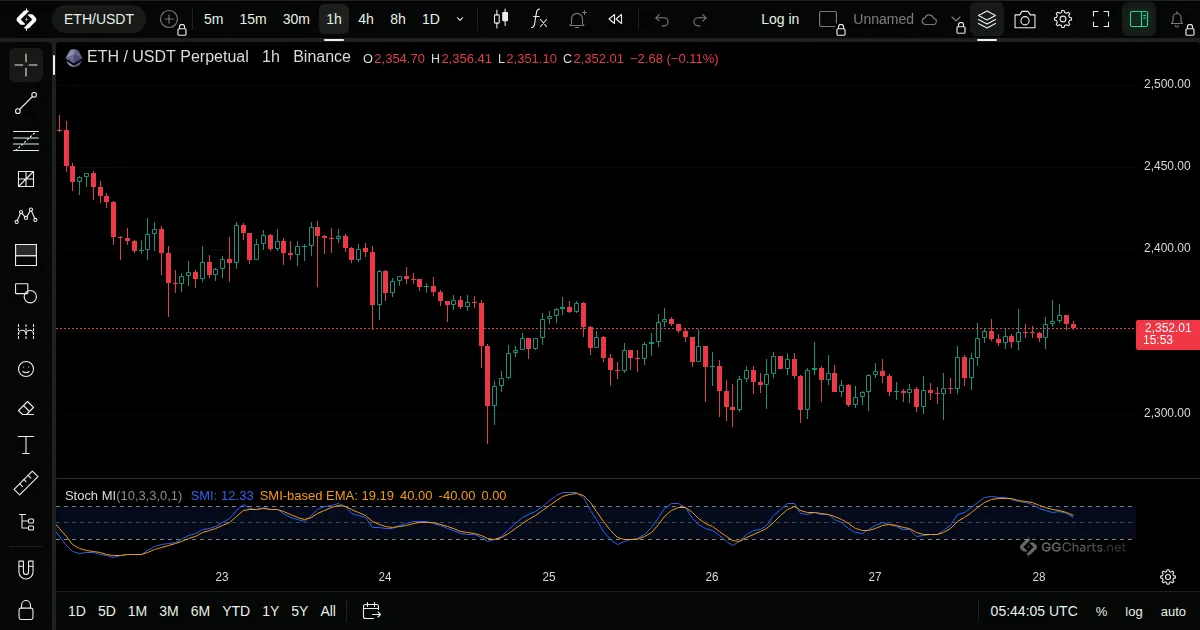
- What it shows
A stochastic that measures where the close is relative to the middle of the range rather than to its edges.
- How it is built
It takes the distance of the close from the midpoint of the range, smooths it twice, and scales it by half of the smoothed range.
Default: %K 10, %D 3, EMA 3.
- How traders read it
- Above 40 is read as overbought, below -40 as oversold.
- A cross of the signal line is the usual signal.
- Smoother than the standard stochastic.
- History
Introduced by William Blau in Technical Analysis of Stocks and Commodities magazine, January 1993.
William Blau, 1993
Related indicators
Price Momentum OscillatorTrend Strength IndexPring's Special KAdvance-Decline Ratio (Bars)