Trend Strength Index
Oscillators, TSI
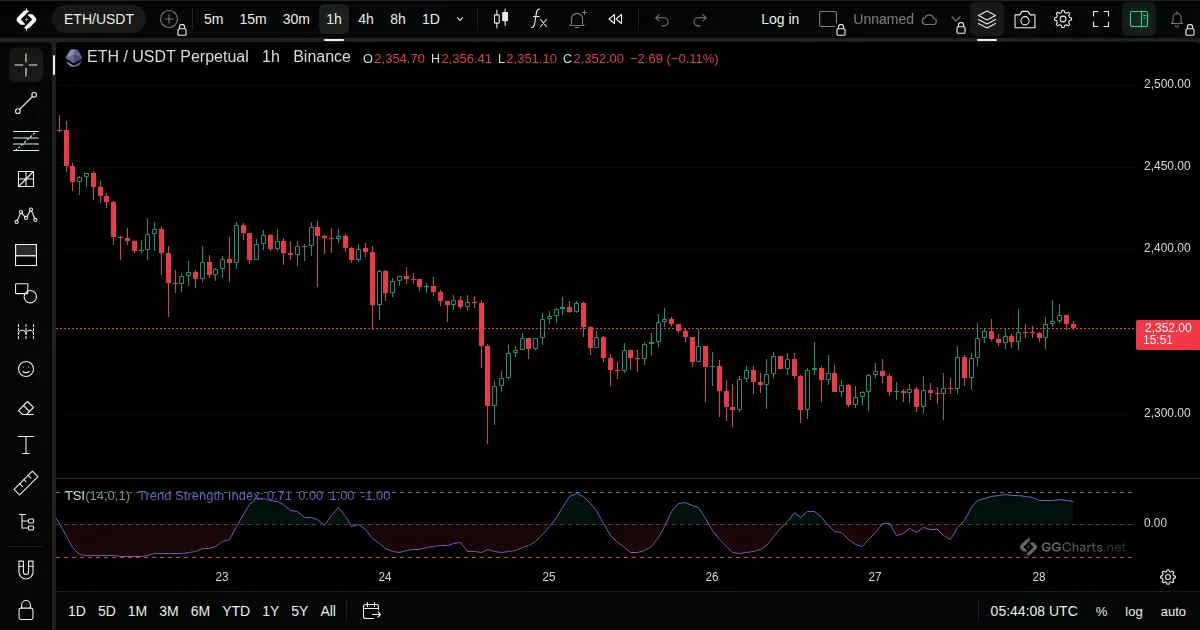
- What it shows
Shows how strongly price is trending, using the correlation of price with time.
- How it is built
It measures how closely price follows a straight line over the period.
Default: Length 14.
- How traders read it
- Near 1 means a smooth rise, near -1 a smooth fall.
- Near zero means no trend.
- Useful to tell a trend from a range.
Related indicators
Pring's Special KAdvance-Decline Ratio (Bars)RSI Divergence IndicatorGG-Osc