RSI Divergence Indicator
Oscillators
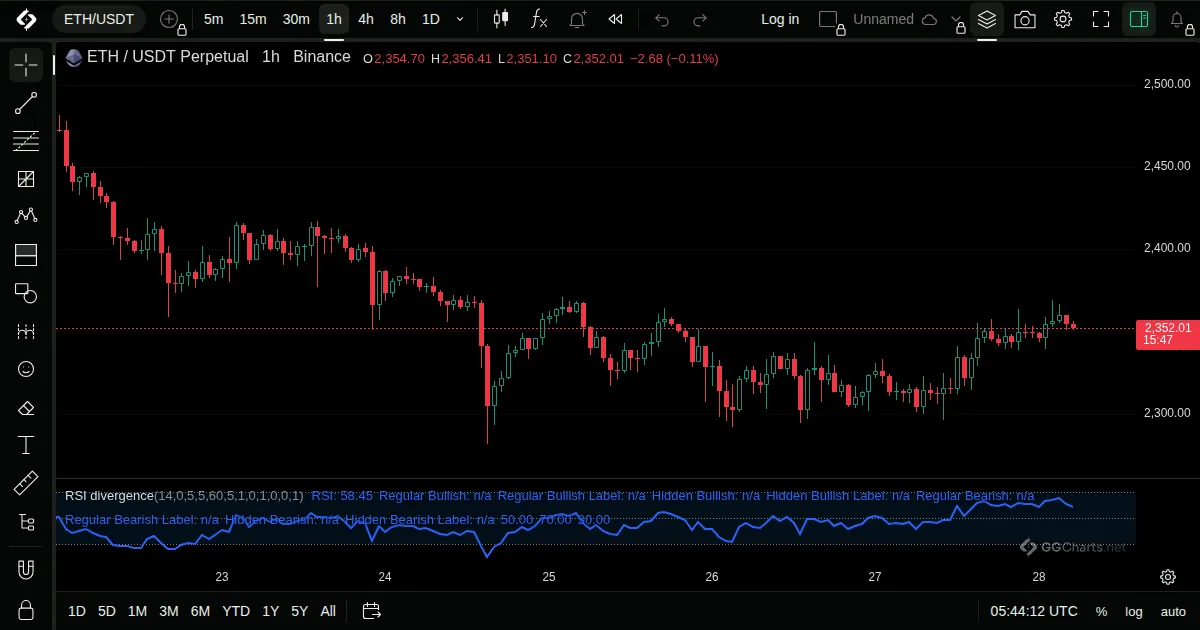
- What it shows
RSI with markers on the chart where it disagrees with price: a divergence.
- How it is built
It looks for places where price made a new extreme but RSI did not, and marks them.
Default: RSI length is set in the Inputs window.
- How traders read it
- A divergence is read as a weakening move.
- It is a warning, not an entry.
- Divergences can last long in a strong trend.
Related indicators
GG-OscRelative Strength IndexMoving Average Convergence DivergenceStochastic