Williams %R
Oscillators
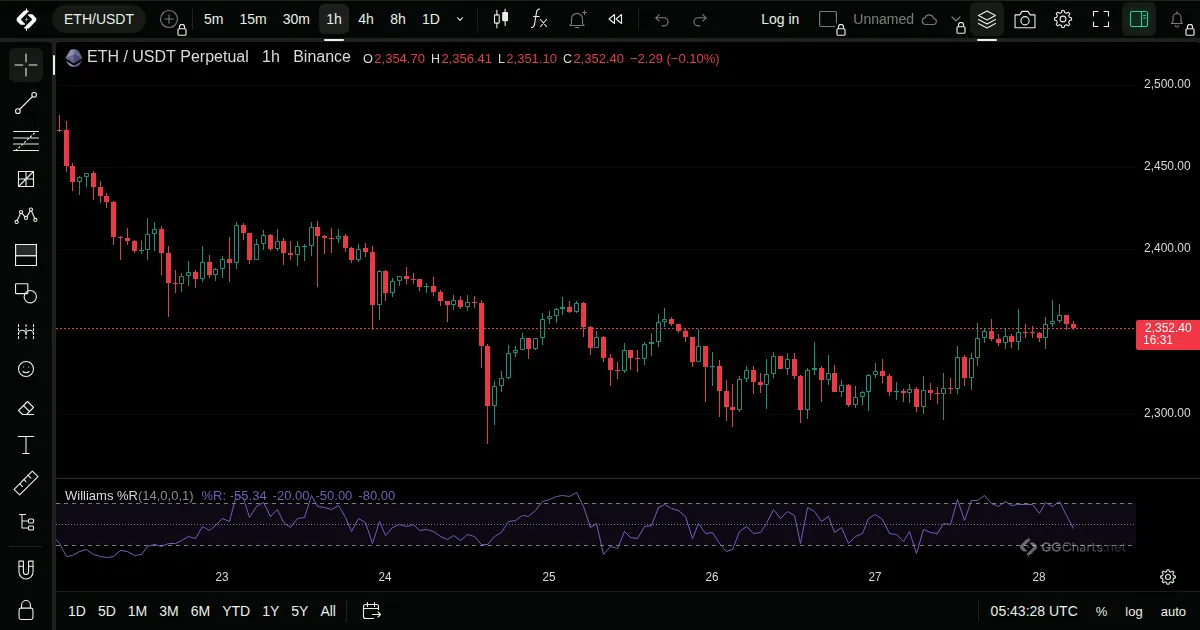
- What it shows
A line from 0 down to -100 that shows how close the close is to the recent high.
- How it is built
It compares the latest close with the highest high of the period, relative to the whole high to low range.
Default: Length 14, source close.
- How traders read it
- Near 0 is close to the recent high, near -100 close to the recent low.
- Above -20 is read as overbought, below -80 as oversold.
- Like other bounded oscillators, it can stay at an extreme in a trend.