TRIX
Oscillators
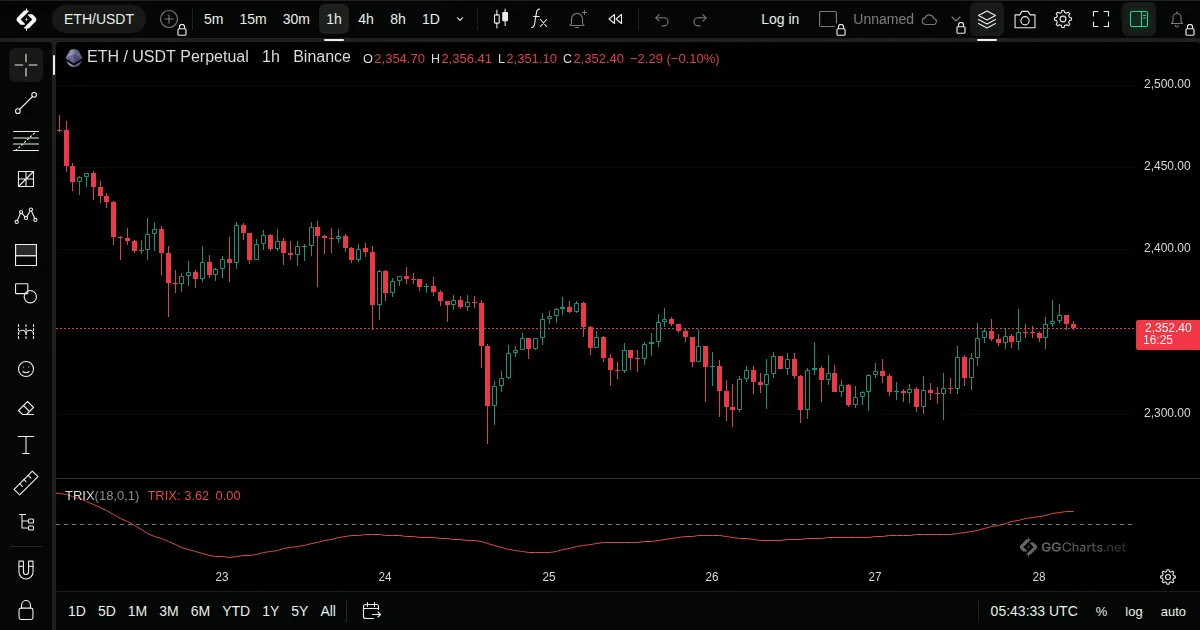
- What it shows
The percent rate of change of a triple-smoothed average of price. It filters out small moves and shows the underlying momentum.
- How it is built
An EMA is taken three times in a row, and the one-bar percent change of the result is plotted.
Default: Length 18.
- How traders read it
- Above zero is rising momentum, below zero falling.
- Zero crossings are the usual signals.
- A smooth line with few false turns, at the cost of delay.
- History
Developed by Jack Hutson, the founding editor of Technical Analysis of Stocks and Commodities magazine, in the 1980s.
Jack Hutson, 1980s