Bias
Oscillators
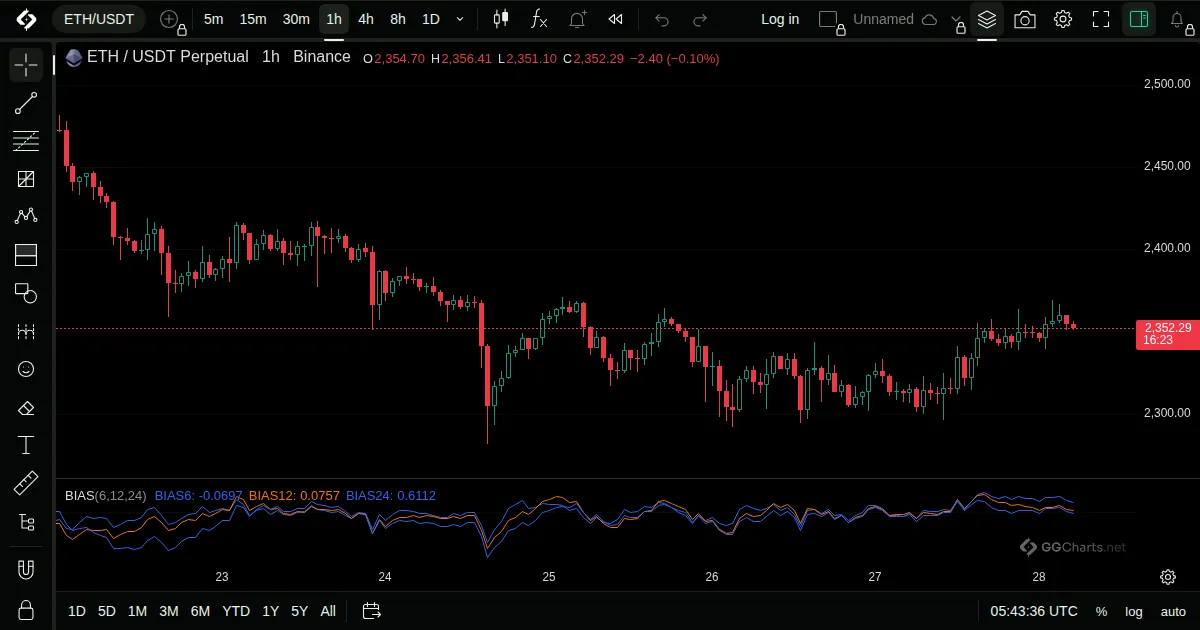
- What it shows
The distance of price from its moving average, in percent.
- How it is built
The close minus the average, divided by the average. Several lengths can be shown together.
Default: Set in the Inputs window.
- How traders read it
- Far above zero means price is stretched above the average.
- Far below zero means stretched below it.
- Usually watched for a return toward the average.