Psychological Line
Oscillators
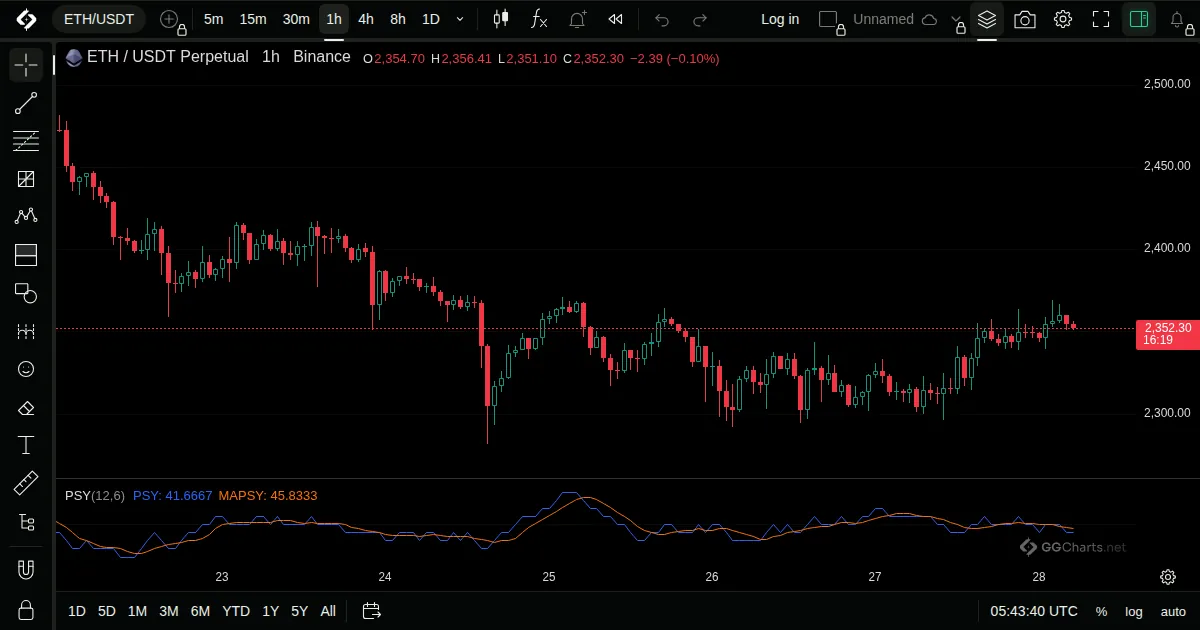
- What it shows
The share of the last N bars that closed higher than the previous one, as a percent.
- How it is built
Counts the up bars in the window and divides by the window length.
Default: Set in the Inputs window.
- How traders read it
- 50 is balance, high values mean many up bars.
- Extreme readings show a one-sided market.
- It counts bars, not their size.
Related indicators
Balance of PowerBull Bear PowerChande Momentum OscillatorConnors RSI