Connors RSI
Oscillators, CRSI
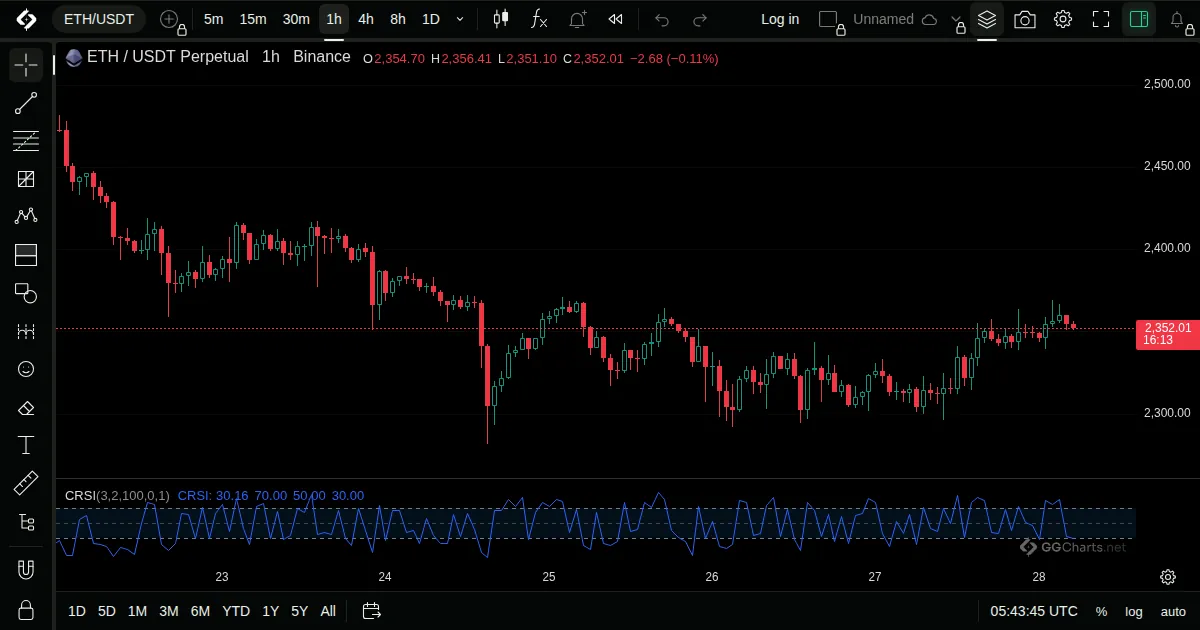
- What it shows
A composite of three measures: a short RSI, the length of the current up or down streak, and the percent rank of the latest change.
- How it is built
The three values are averaged into a single 0 to 100 line.
Default: RSI length 3, up/down length 2, ROC length 100.
- How traders read it
- Low values are read as oversold, high values as overbought.
- Fast and meant for short-term moves.
- Works best with a trend filter.
Related indicators
Coppock CurveDetrended Price OscillatorFisher TransformKnow Sure Thing