Coppock Curve
Oscillators
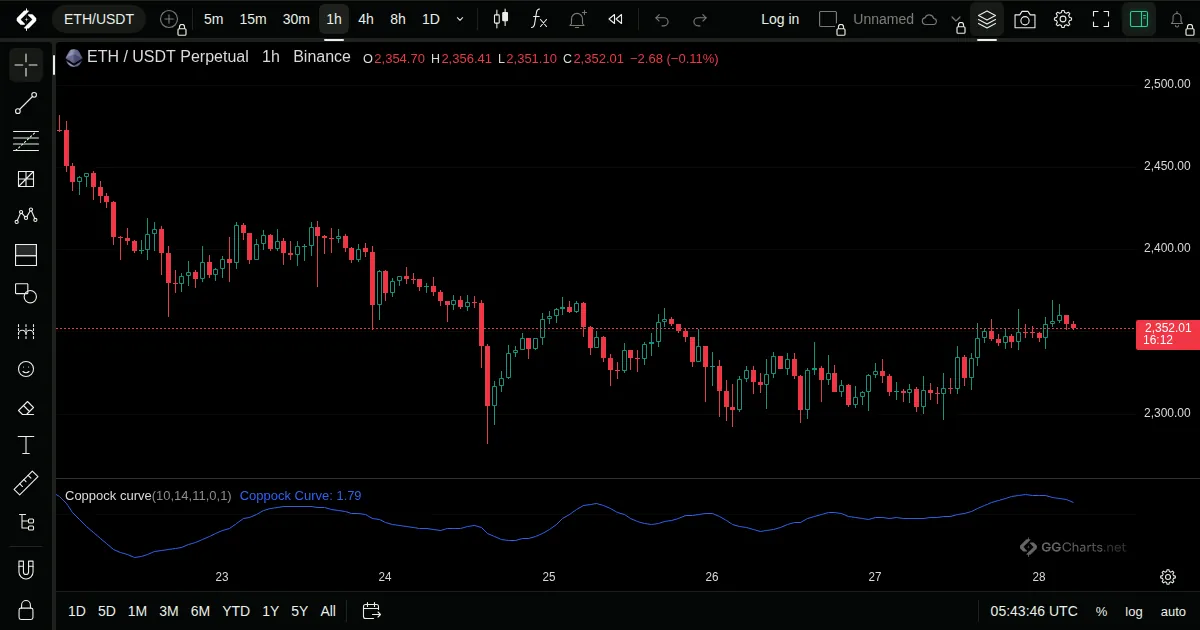
- What it shows
A long-term momentum line based on the sum of two rates of change, smoothed.
- How it is built
It adds the 14 and 11 period rates of change and smooths the sum with a weighted average.
Default: WMA length 10, long RoC 14, short RoC 11.
- How traders read it
- Turning up from below zero is the classic buy sign.
- Designed for long-term bottoms on monthly charts.
- Less meaningful on short timeframes.
- History
Published by Edwin Coppock in Barron's magazine in October 1962.
Edwin Coppock, 1962
Related indicators
Detrended Price OscillatorFisher TransformKnow Sure ThingPrice Oscillator