Price Oscillator
Oscillators, PPO
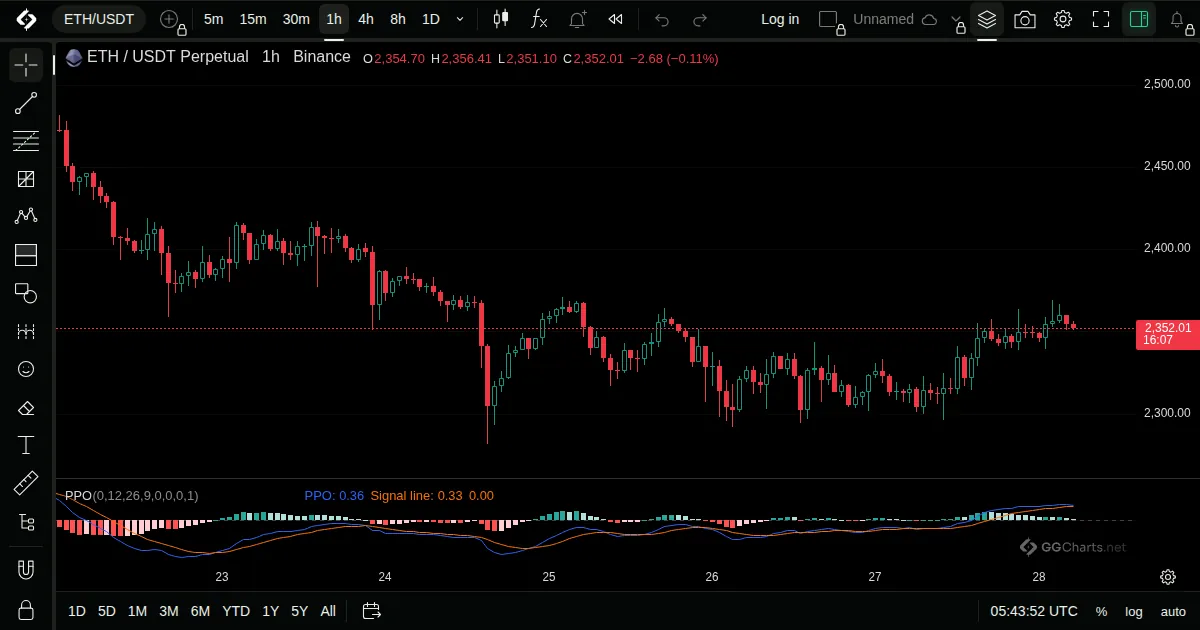
- What it shows
MACD shown as a percent of the slow average, which makes it comparable across markets and over time.
- How it is built
The fast EMA minus the slow EMA, divided by the slow EMA, with a signal line and histogram.
Default: Fast 12, slow 26, signal 9.
- How traders read it
- Above zero: the fast average is above the slow one.
- The signal cross is the usual trigger.
- Percent scale lets you compare it between coins.
Related indicators
Relative Vigor IndexSMI Ergodic IndicatorTrue Strength IndexUltimate Oscillator