True Strength Index
Oscillators, TSI
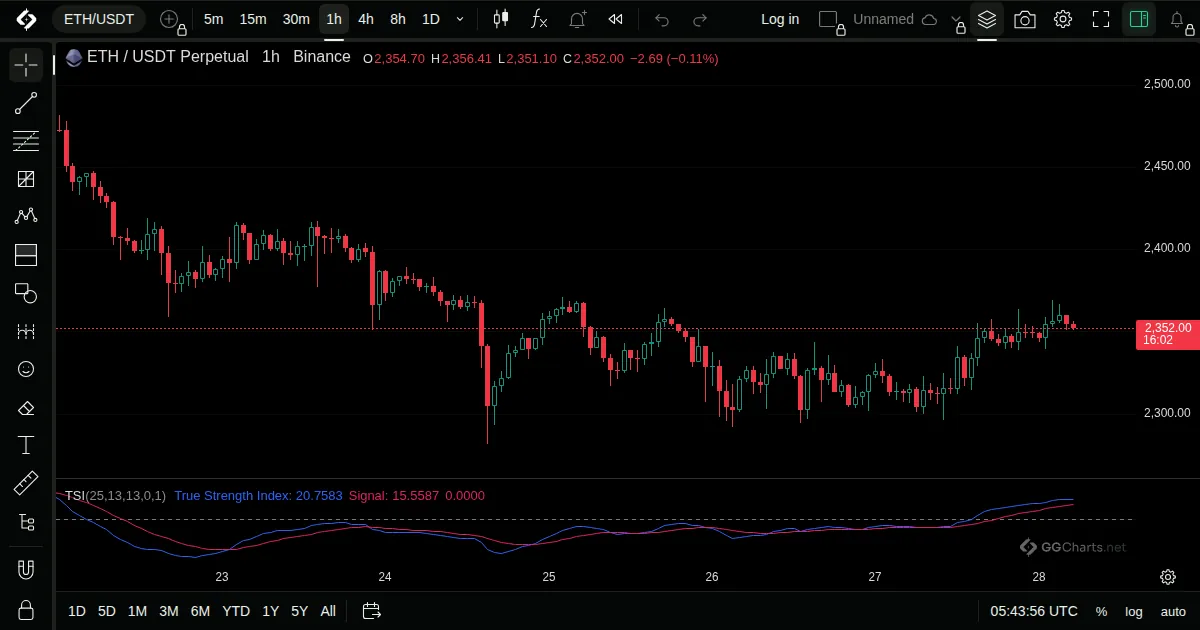
- What it shows
A smoothed momentum line that shows both trend direction and how stretched the move is.
- How it is built
The change of price is smoothed twice, and divided by the same double smoothing of its absolute size.
Default: Long 25, short 13, signal 13.
- How traders read it
- Above zero: uptrend momentum.
- A cross of the signal line is the usual signal.
- Extremes show stretched moves.
- History
Described by William Blau in his book Momentum, Direction, and Divergence (1995).
William Blau, 1995
Related indicators
Ultimate OscillatorSMI Ergodic OscillatorWoodies CCIRank Correlation Index