Ultimate Oscillator
Oscillators, UO
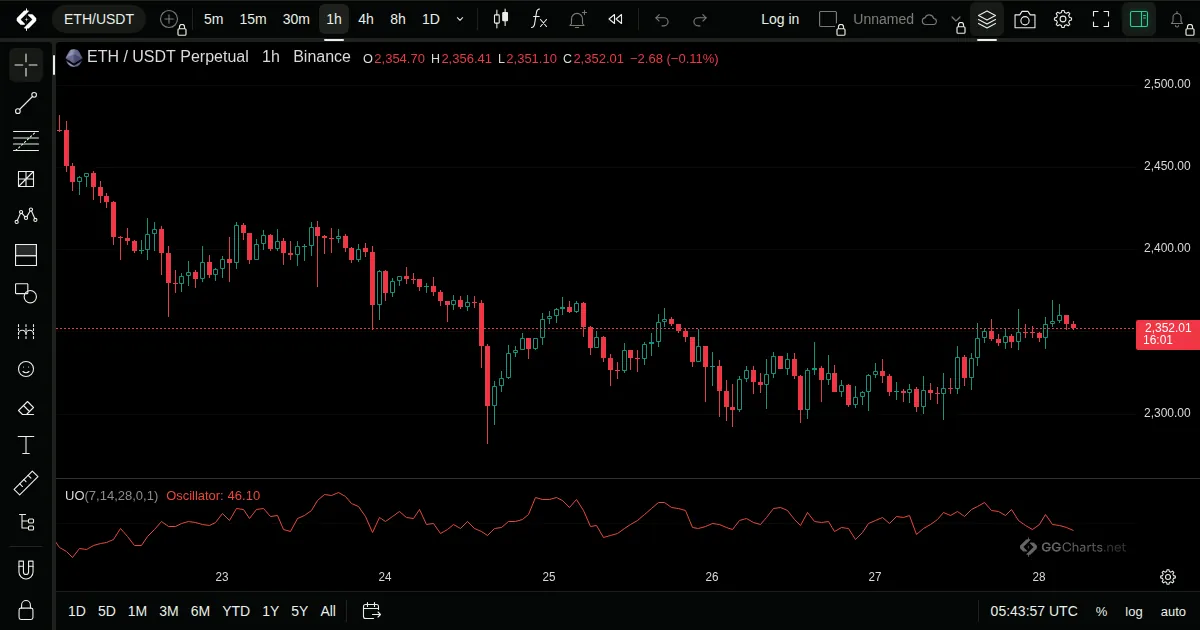
- What it shows
An oscillator that mixes three time spans so that it is less tied to a single period.
- How it is built
It compares buying pressure with the true range over 7, 14 and 28 bars and combines them with weights.
Default: Fast 7, middle 14, slow 28.
- How traders read it
- Above 70 is read as overbought, below 30 as oversold.
- A divergence from price is the classic signal.
- Combining spans reduces false signals.
- History
Developed by Larry Williams in 1976.
Larry Williams, 1976
Related indicators
SMI Ergodic OscillatorWoodies CCIRank Correlation IndexRCI Ribbon