SMI Ergodic Indicator
Oscillators, SMII
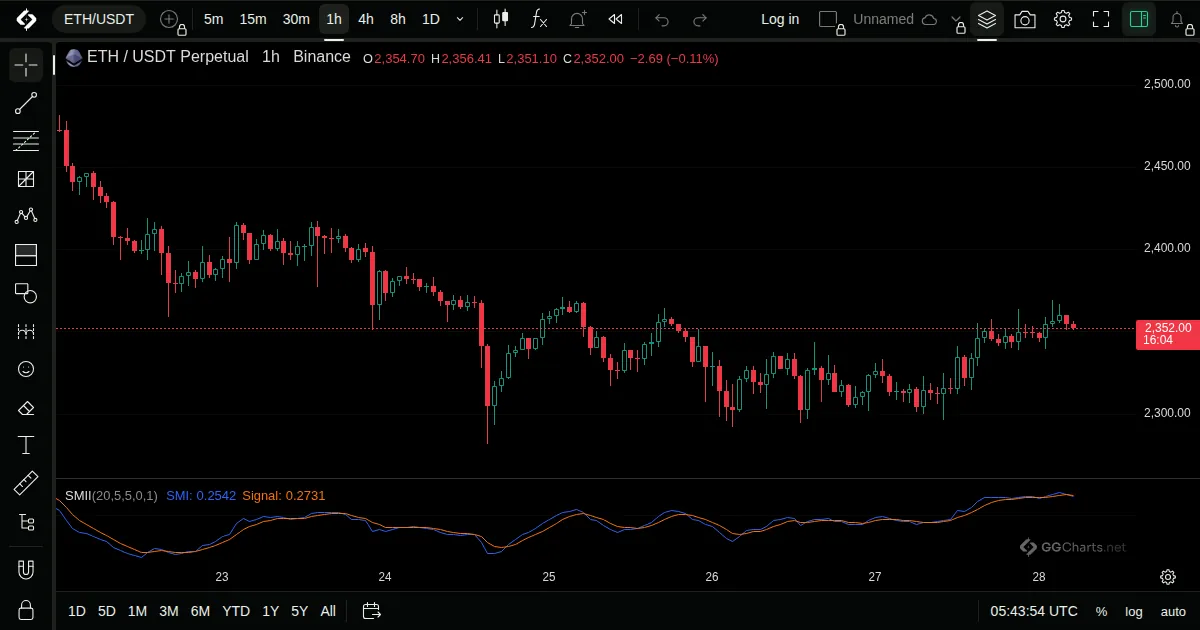
- What it shows
A smoothed momentum line with a signal line, built to show the direction of the trend with little noise.
- How it is built
The change of price is smoothed twice with long and short averages, scaled by the same smoothing of its absolute value, and a signal line is added.
Default: Long 20, short 5, signal 5.
- How traders read it
- A cross of the signal line is the usual trigger.
- Above zero: positive momentum.
- Little noise, with some delay.
- History
Described by William Blau in his book Momentum, Direction, and Divergence (1995).
William Blau, 1995
Related indicators
True Strength IndexUltimate OscillatorSMI Ergodic OscillatorWoodies CCI