Relative Vigor Index
Oscillators, RVGI
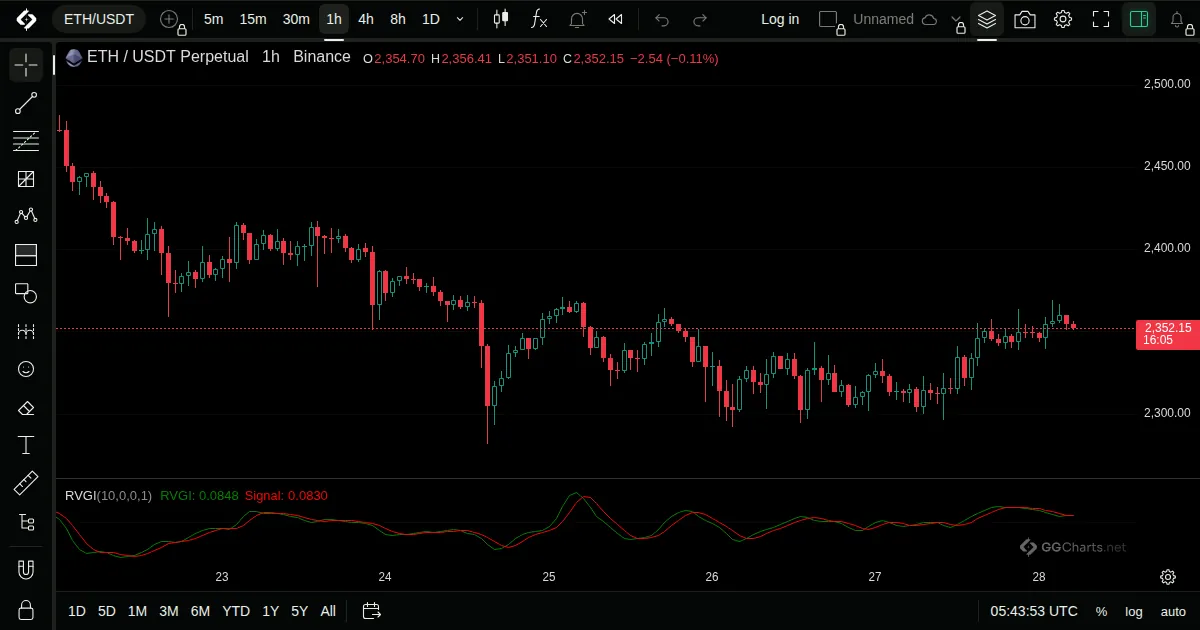
- What it shows
Compares where bars close against where they open, on the idea that in an uptrend they close higher than they open.
- How it is built
The close minus the open is smoothed and divided by the smoothed range, with a signal line.
Default: Length 10.
- How traders read it
- The line crossing its signal line is the usual signal.
- Above zero: closes tend to be higher than opens.
- Smooth, with some delay.
- History
Presented by John Ehlers in Technical Analysis of Stocks and Commodities magazine, January 2002.
John Ehlers, 2002
Related indicators
SMI Ergodic IndicatorTrue Strength IndexUltimate OscillatorSMI Ergodic Oscillator