Fisher Transform
Oscillators
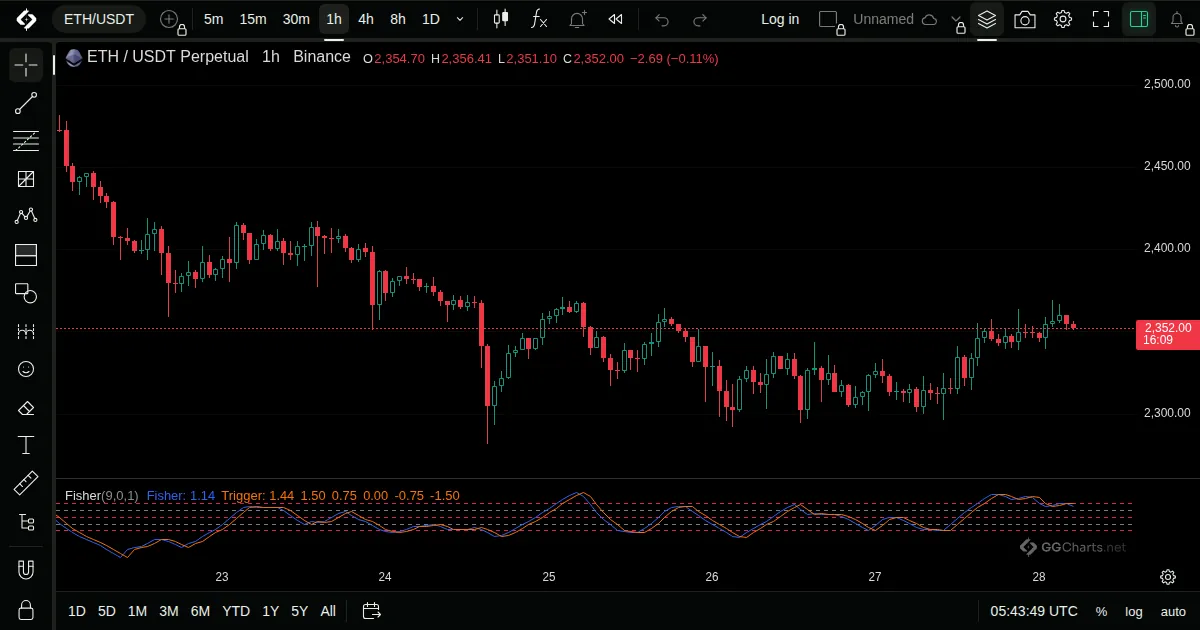
- What it shows
Reshapes prices so their distribution looks more even, which makes turning points sharper.
- How it is built
Price is turned into a value between -1 and 1 within its recent range, and a mathematical transform stretches the extremes.
Default: Length 9.
- How traders read it
- A cross of the line and its one-bar delay marks a possible turn.
- Extremes show a stretched move.
- Sharp, so it turns often.
- History
Presented by John Ehlers in Technical Analysis of Stocks and Commodities magazine, November 2002.
John Ehlers, 2002
Related indicators
Know Sure ThingPrice OscillatorRelative Vigor IndexSMI Ergodic Indicator