Chande Momentum Oscillator
Oscillators, ChandeMO
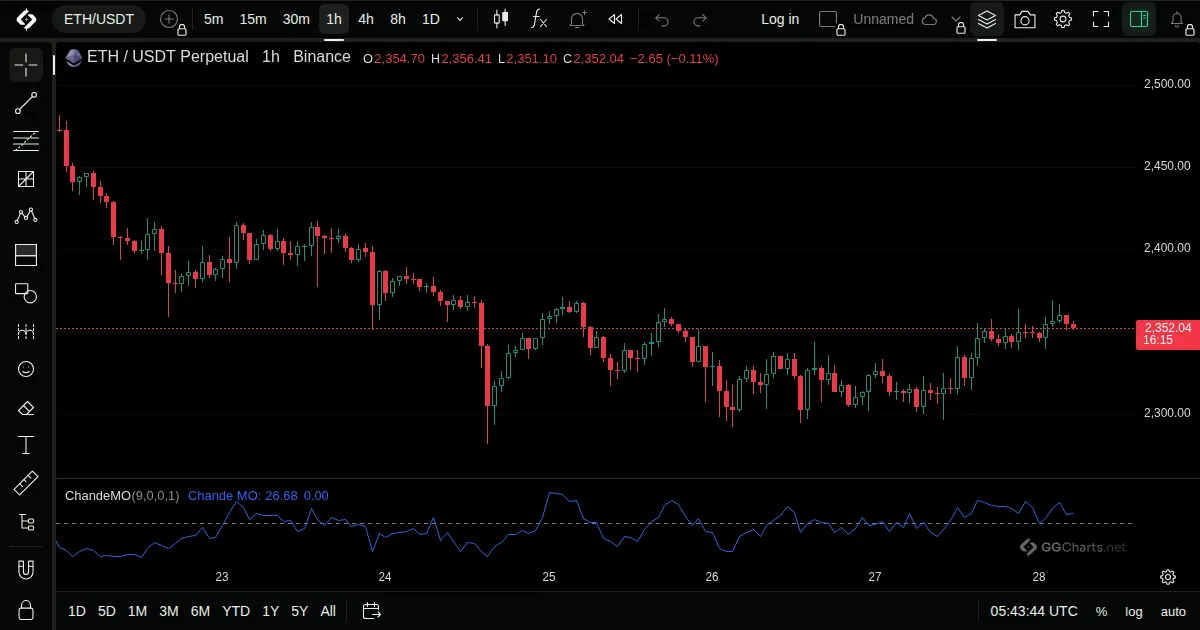
- What it shows
An oscillator between -100 and 100 that compares the sum of recent gains with the sum of recent losses.
- How it is built
It is the sum of up moves minus the sum of down moves, divided by their total, over the period.
Default: Length 9, source close.
- How traders read it
- Above 50 is read as overbought, below -50 as oversold.
- Zero crossings show a change of side.
- More responsive than RSI, with a wider range.
- History
Described by Tushar Chande in the book The New Technical Trader (1994).
Tushar Chande, 1994
Related indicators
Connors RSICoppock CurveDetrended Price OscillatorFisher Transform