Bull Bear Power
Oscillators, BBP
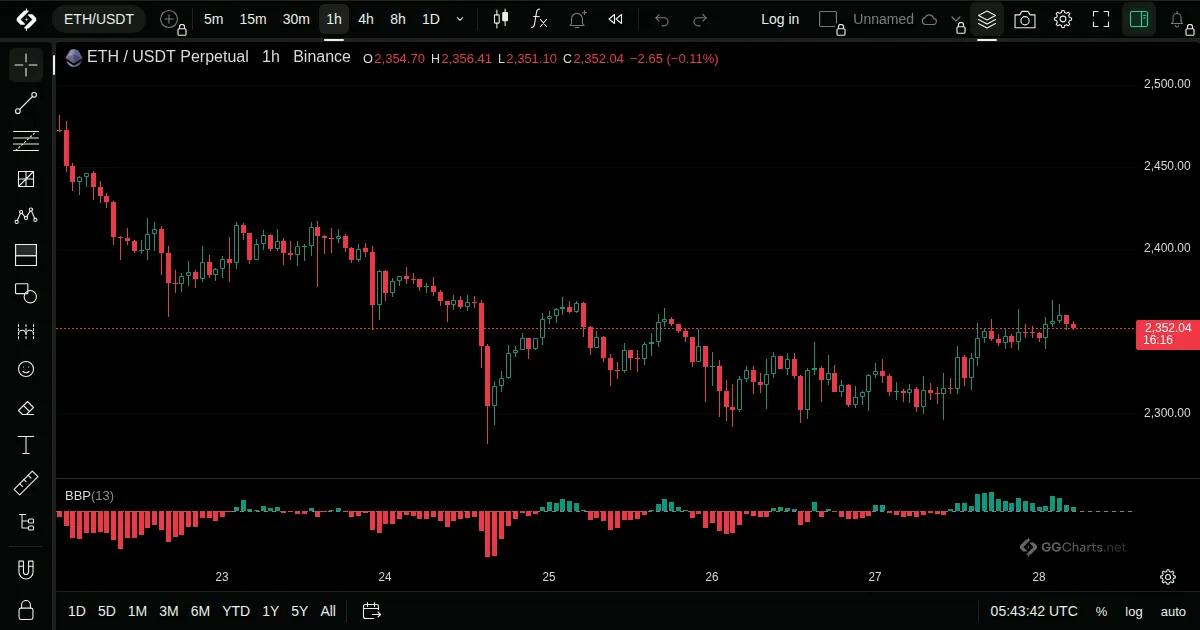
- What it shows
Two bars showing how far the highs and lows are above and below an EMA, a view of the power of buyers and sellers.
- How it is built
Bull power is the bar's high minus an EMA, bear power is its low minus the same EMA.
Default: Length 13.
- How traders read it
- Bull power above zero shows buyers pushing price above the average.
- Bear power below zero shows sellers pushing under it.
- Often read with the slope of the EMA.
- History
Known as Elder-ray, described by Alexander Elder in his book Trading for a Living (1993).
Alexander Elder, 1993
Related indicators
Chande Momentum OscillatorConnors RSICoppock CurveDetrended Price Oscillator