Balance of Power
Oscillators
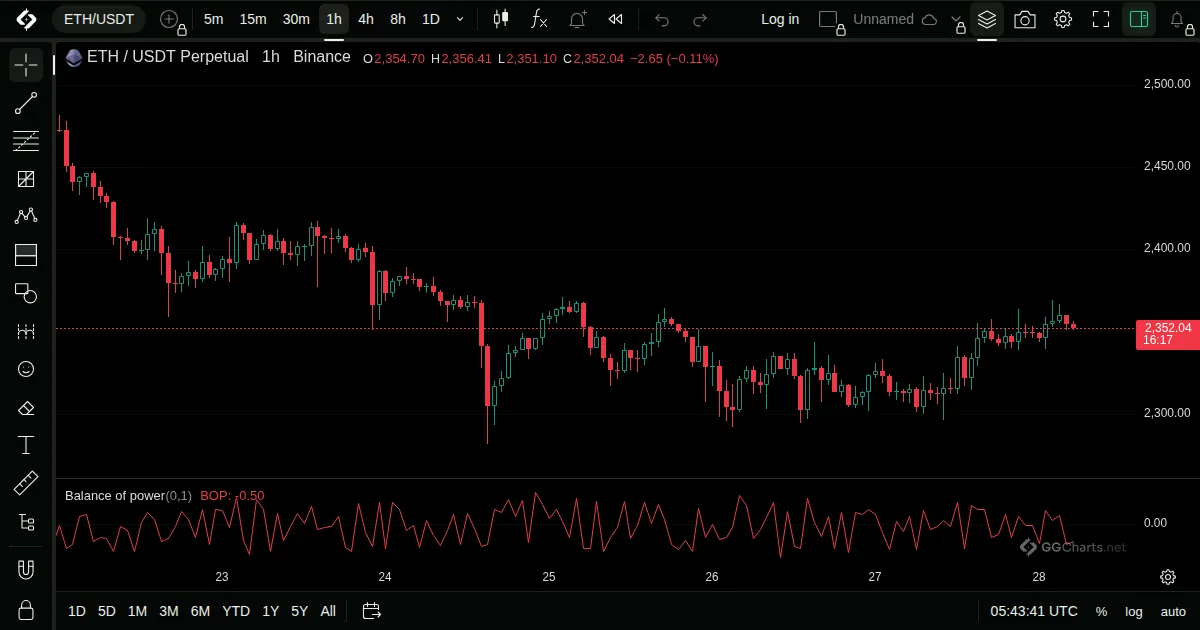
- What it shows
Shows who controls the bar, buyers or sellers, by comparing the move from open to close with the bar's range.
- How it is built
For each bar it divides close minus open by high minus low.
Default: No inputs.
- How traders read it
- Above zero: buyers had the bar. Below zero: sellers.
- A rising line shows buyers gaining control.
- It is jumpy bar to bar, so look at its trend.
- History
Presented by Igor Livshin in Technical Analysis of Stocks and Commodities magazine, August 2001.
Igor Livshin, 2001
Related indicators
Bull Bear PowerChande Momentum OscillatorConnors RSICoppock Curve