CR
Oscillators
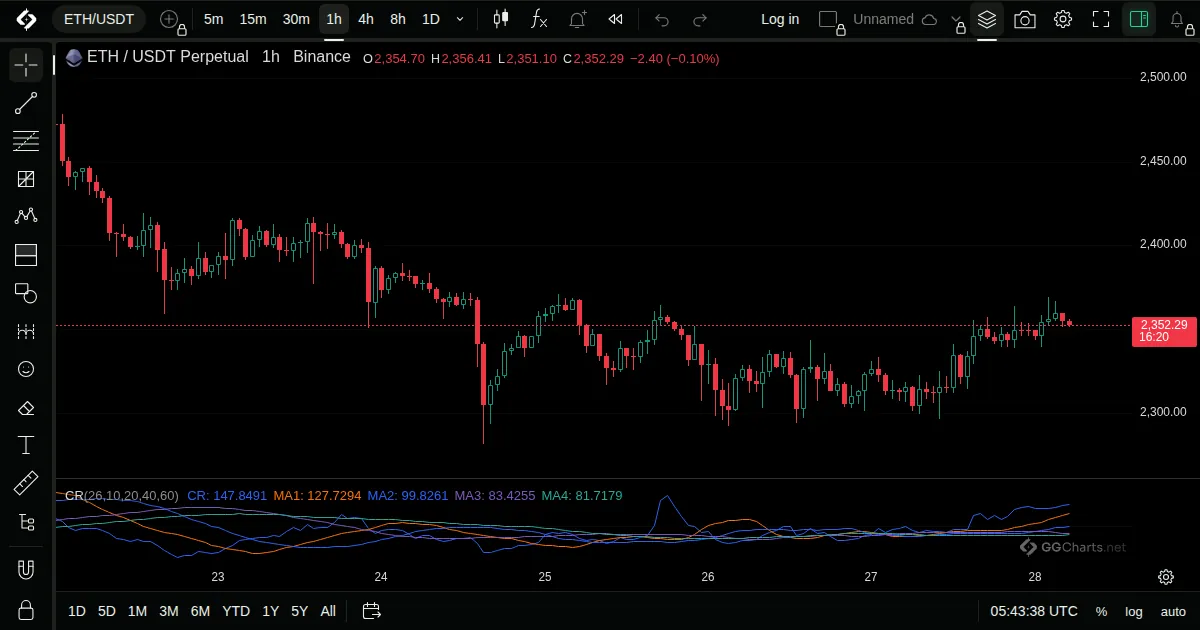
- What it shows
A line that compares the buying and selling pressure of the bars relative to their midpoint, with moving average lines.
- How it is built
It sums the strength above the previous midpoint and the weakness below it over the period.
Default: Set in the Inputs window.
- How traders read it
- A high value shows buyers in control.
- The moving average lines act as signals.
- A less common indicator, so test it on your own market.
Related indicators
Psychological LineBalance of PowerBull Bear PowerChande Momentum Oscillator