BRAR
Oscillators
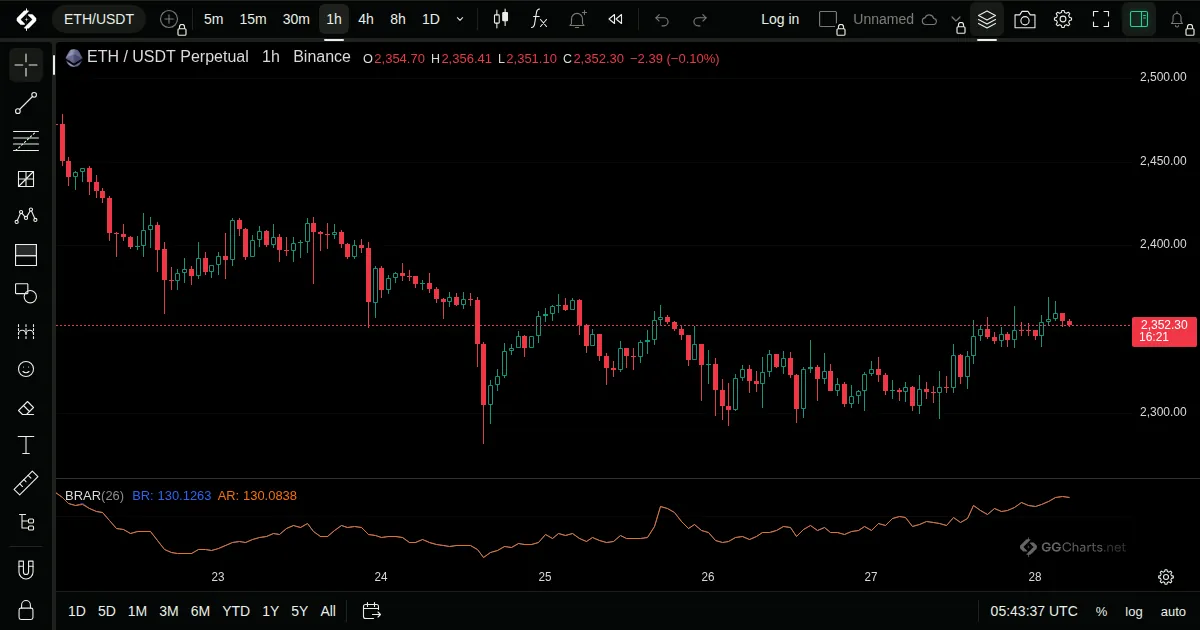
- What it shows
Two lines that compare buying and selling pressure: AR looks at the bar's range, BR at the gaps between bars.
- How it is built
AR sums how far each high is above the open against how far each open is above the low. BR does the same against the previous close.
Default: Set in the Inputs window.
- How traders read it
- Values near 100 are balanced.
- Values far above or below 100 show strong pressure one way.
- The two lines are compared with each other.