KDJ
Oscillators
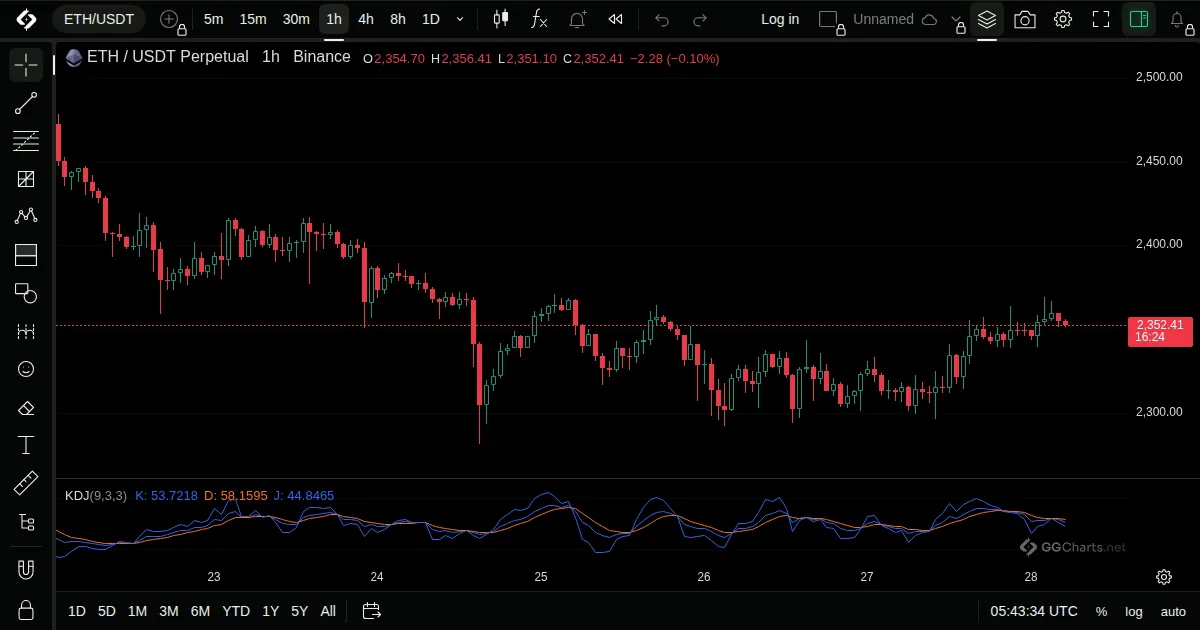
- What it shows
A stochastic oscillator with a third line, J, that reacts faster than K and D and goes beyond 0 and 100.
- How it is built
K and D are the smoothed stochastic lines. J is calculated from them as 3K minus 2D, so it exaggerates their moves.
Default: Set in the Inputs window.
- How traders read it
- K crossing D is the usual signal.
- J leaving the 0 to 100 range shows a stretched move.
- Fast and noisy, so it is best used with a trend view.