Rate Of Change
Oscillators, ROC
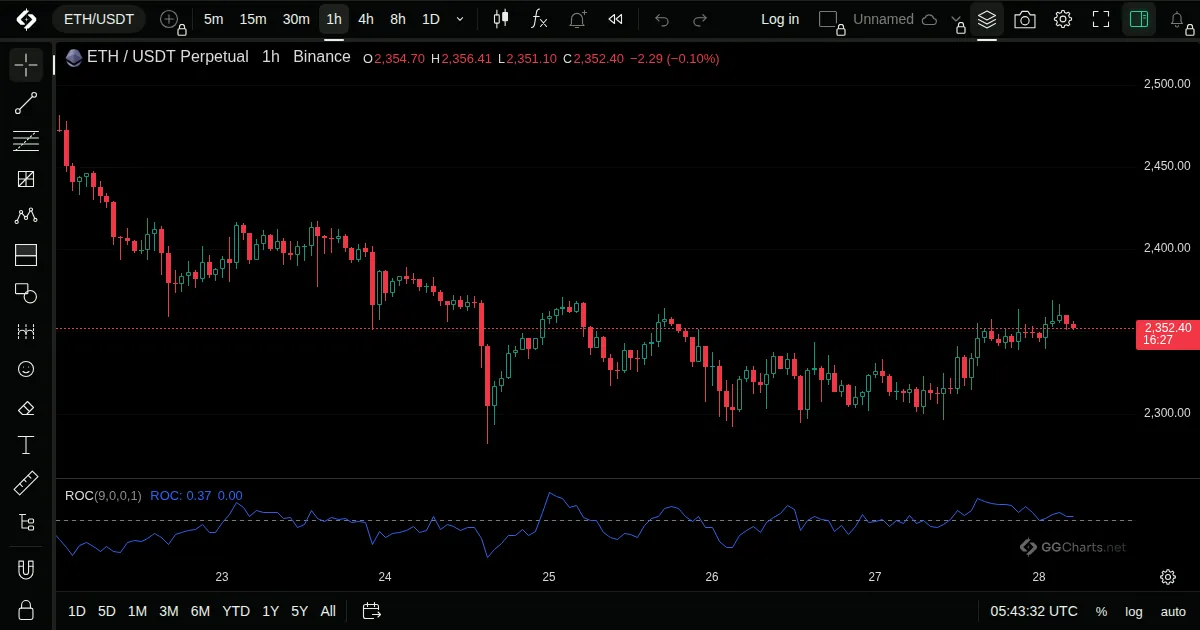
- What it shows
The percent change in price over the last N bars.
- How it is built
The current close divided by the close N bars ago, minus 1, shown as a percent.
Default: Length 9, source close.
- How traders read it
- Above zero: price is up over the period.
- Extreme values are read as stretched moves.
- A divergence from price shows weakening momentum.