Momentum
Oscillators
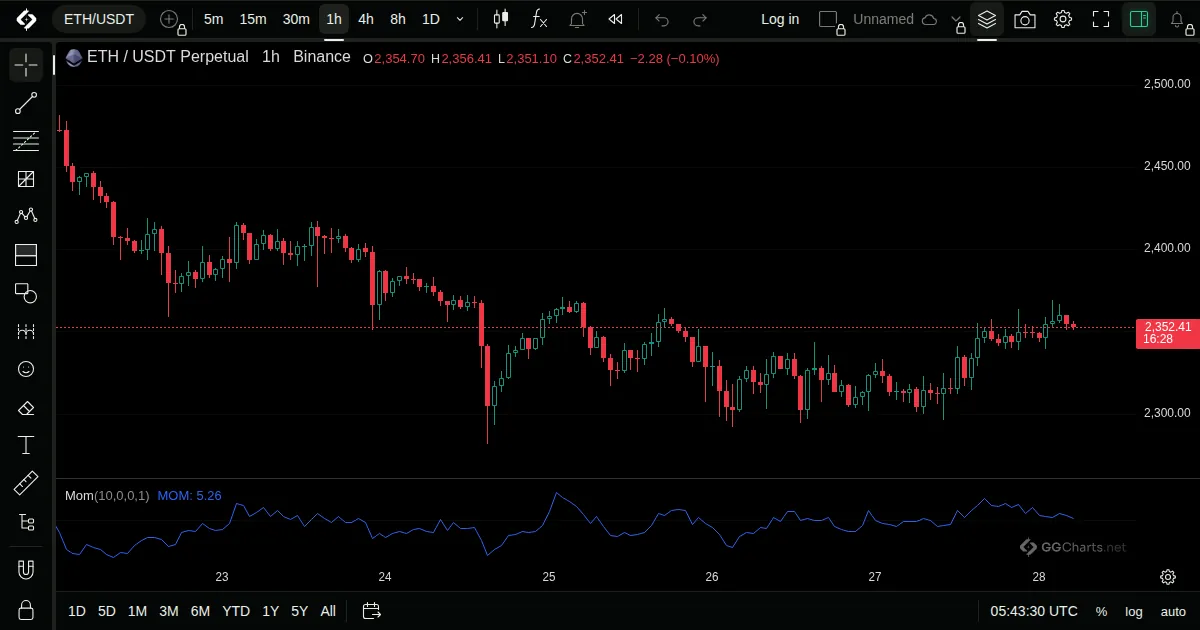
- What it shows
The change in price over the last N bars.
- How it is built
The current close minus the close N bars ago.
Default: Length 10, source close.
- How traders read it
- Above zero: price is higher than N bars ago.
- Rising values show momentum building.
- Zero crossings mark a change of direction over the period.