Awesome Oscillator
Oscillators, AO
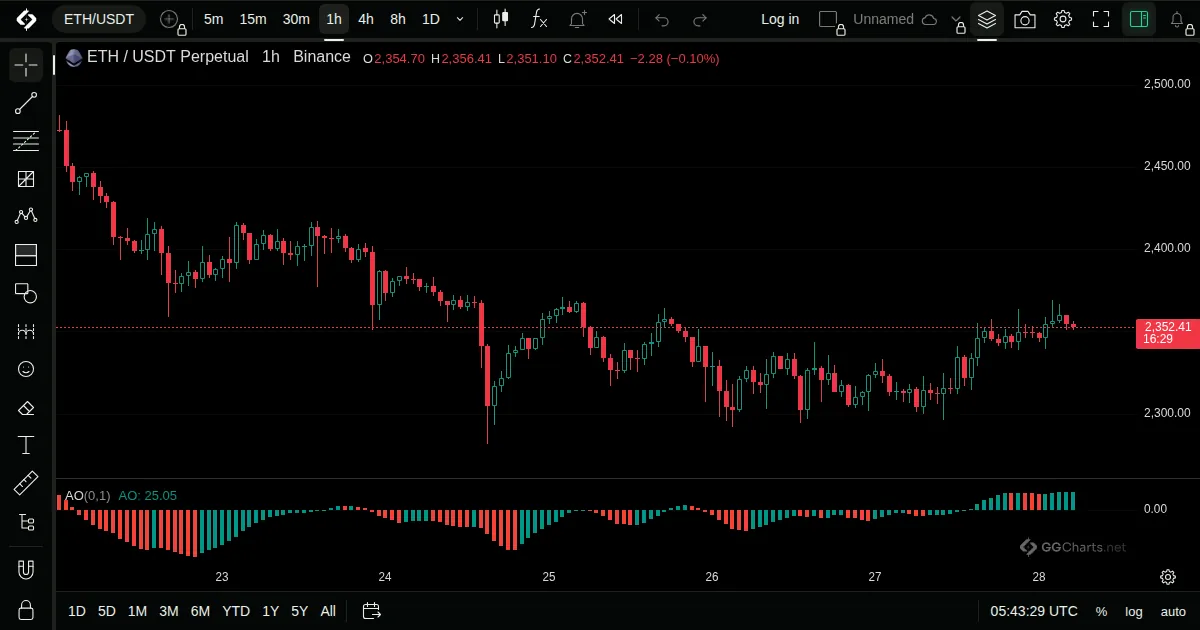
- What it shows
A histogram of the gap between a fast and a slow average of bar midpoints.
- How it is built
It is the 5-bar simple average of the midpoints minus the 34-bar one. Bars are coloured by whether the value rose or fell.
Default: Fixed lengths 5 and 34.
- How traders read it
- Above zero means short-term momentum is above the long-term one.
- Colour changes show momentum speeding up or slowing down.
- Crossing zero is a change of balance.