Commodity Channel Index
Oscillators, CCI
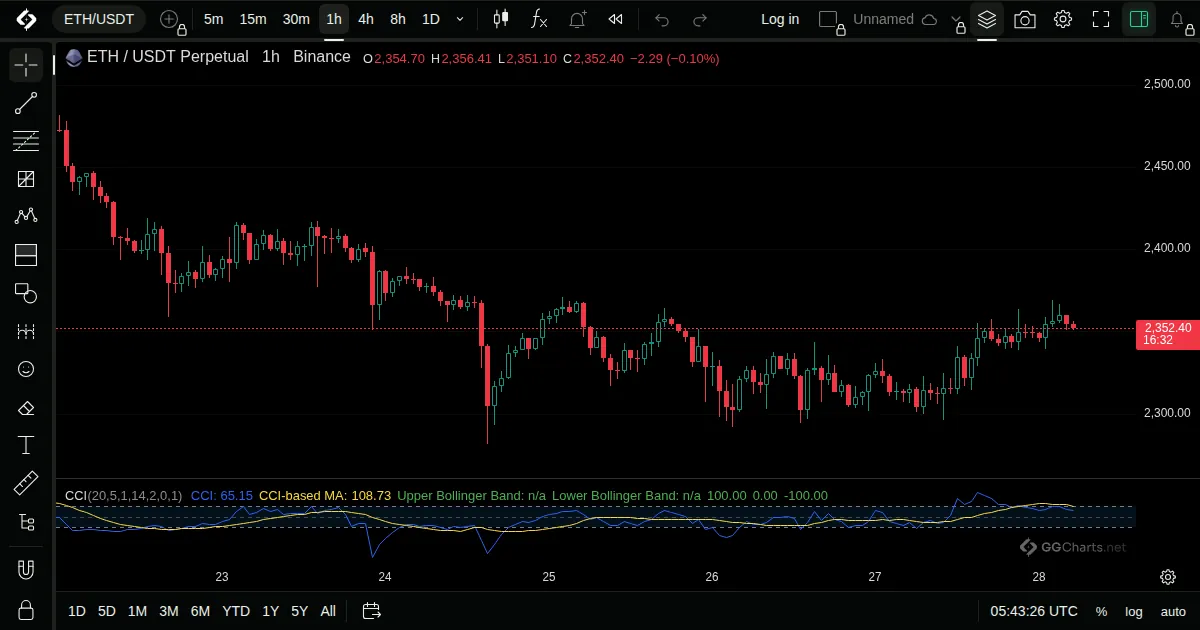
- What it shows
Shows how far the typical price is from its average, in units of its average deviation.
- How it is built
The typical price is the average of high, low and close. CCI is its gap to a moving average, divided by the mean deviation, with a constant to scale it.
Default: Length 20, source hlc3.
- How traders read it
- Readings above 100 or below -100 are seen as strong moves or stretched ones.
- Crossing zero shows a change of side.
- It is not limited to a range, so values can run far.
- History
Introduced by Donald Lambert in Commodities magazine in 1980.
Donald Lambert, 1980