Williams Fractals
Trend
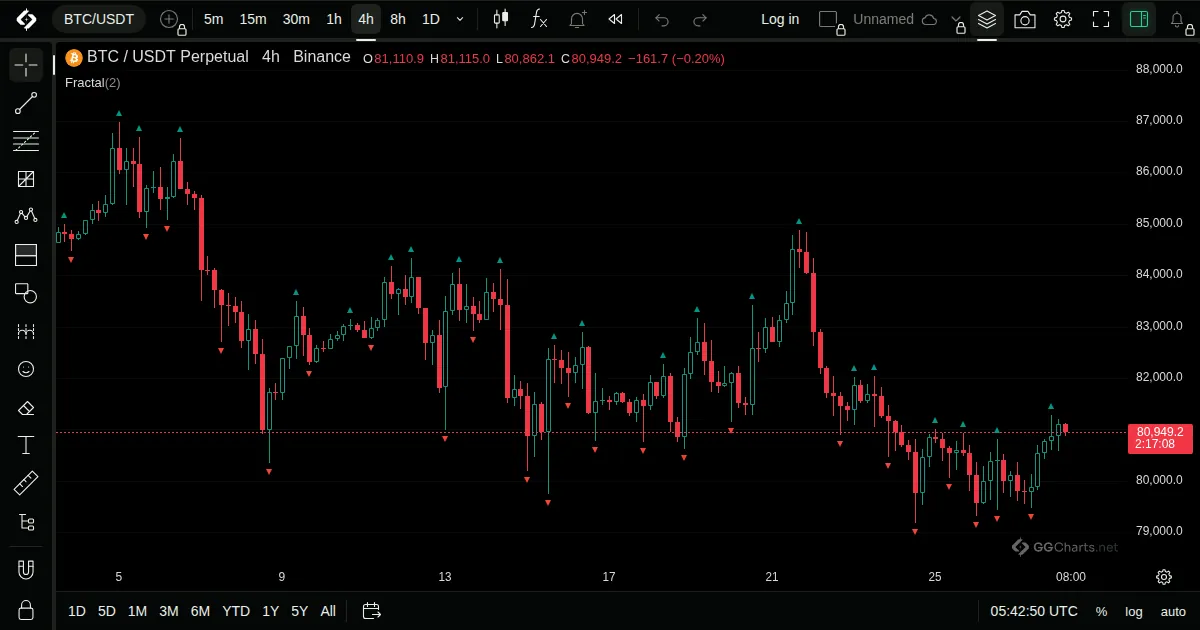
- What it shows
Small arrows on the candles that mark local peaks and troughs, called fractals.
- How it is built
A fractal high is a bar whose high is above the highs of the bars on both sides, a fractal low is the opposite. By default two bars are checked on each side.
Default: Periods 2.
- How traders read it
- Fractal highs and lows are read as swing points, places where price turned.
- They are often used to place stops or to see breakouts.
- A fractal is only confirmed after the bars on its right are closed.
- History
Described by Bill Williams in his book Trading Chaos (1995).
Bill Williams, 1995
Related indicators
Vortex IndicatorChande Kroll StopVolatility StopWilliams Alligator