Vortex Indicator
Trend, VI
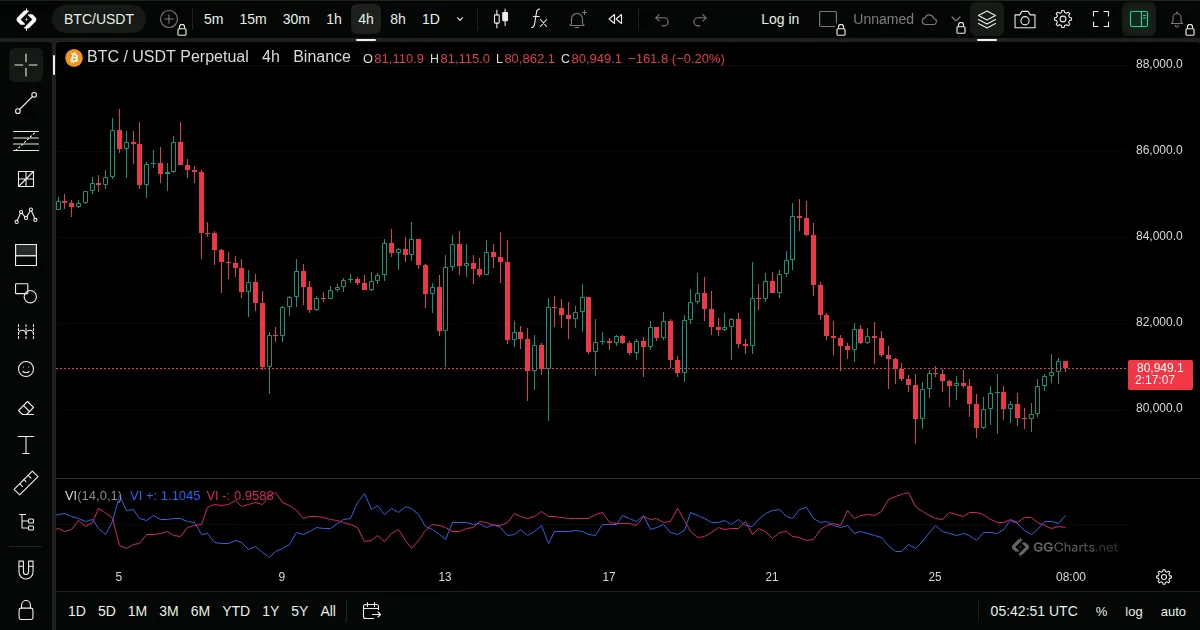
- What it shows
Two lines, VI+ and VI-, that measure the strength of upward and downward movement.
- How it is built
It compares each bar's high with the previous bar's low, and the low with the previous high, sums them over the period and sets them against the true range.
Default: Length 14.
- How traders read it
- VI+ above VI- favours the uptrend, the reverse the downtrend.
- A crossing of the two is the classic signal.
- Frequent crossings mean a market without a clear trend.
- History
Presented by Etienne Botes and Douglas Siepman in Technical Analysis of Stocks and Commodities magazine, January 2010.
Etienne Botes and Douglas Siepman, 2010
Related indicators
Chande Kroll StopVolatility StopWilliams AlligatorKaufman's Adaptive Moving Average