Volatility Stop
Trend, VStop
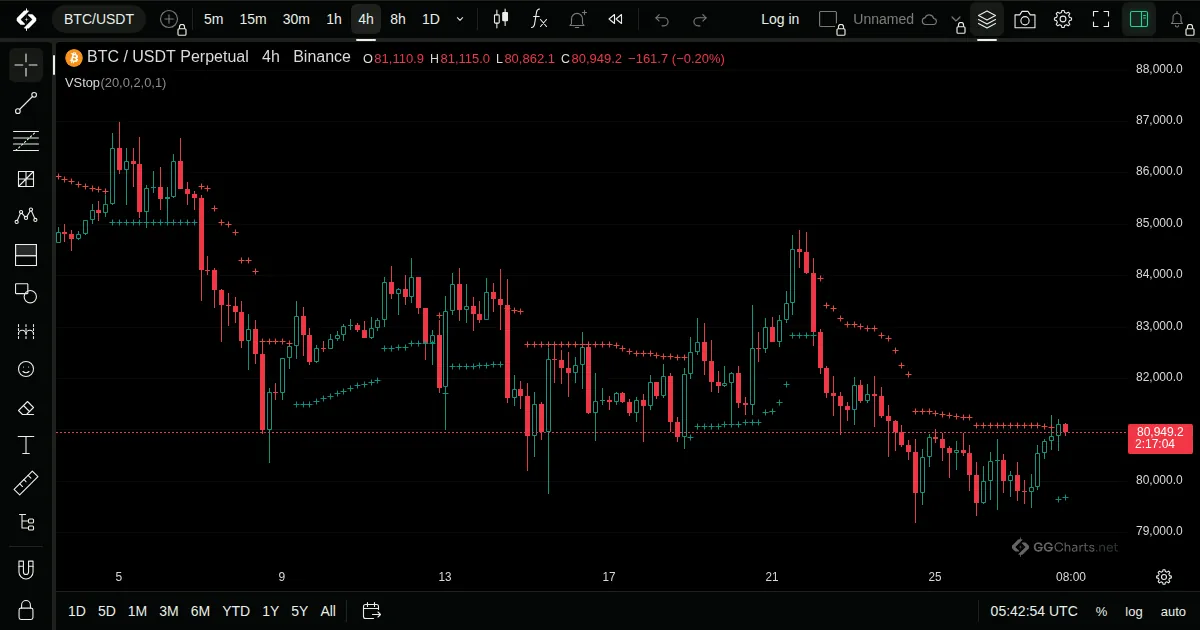
- What it shows
A trailing stop line that follows price at a distance based on volatility and flips when price crosses it.
- How it is built
The line is set a multiple of the Average True Range from the extreme close and moves only with the trend. A cross reverses it to the other side.
Default: Length 20, multiplier 2, source close.
- How traders read it
- Below price: uptrend. Above price: downtrend.
- The flip is read as a trend change or a stop-out.
- A larger multiplier gives fewer flips and a wider stop.
Related indicators
Williams AlligatorKaufman's Adaptive Moving AverageMedianChandelier Exit