Chande Kroll Stop
Trend, CKS
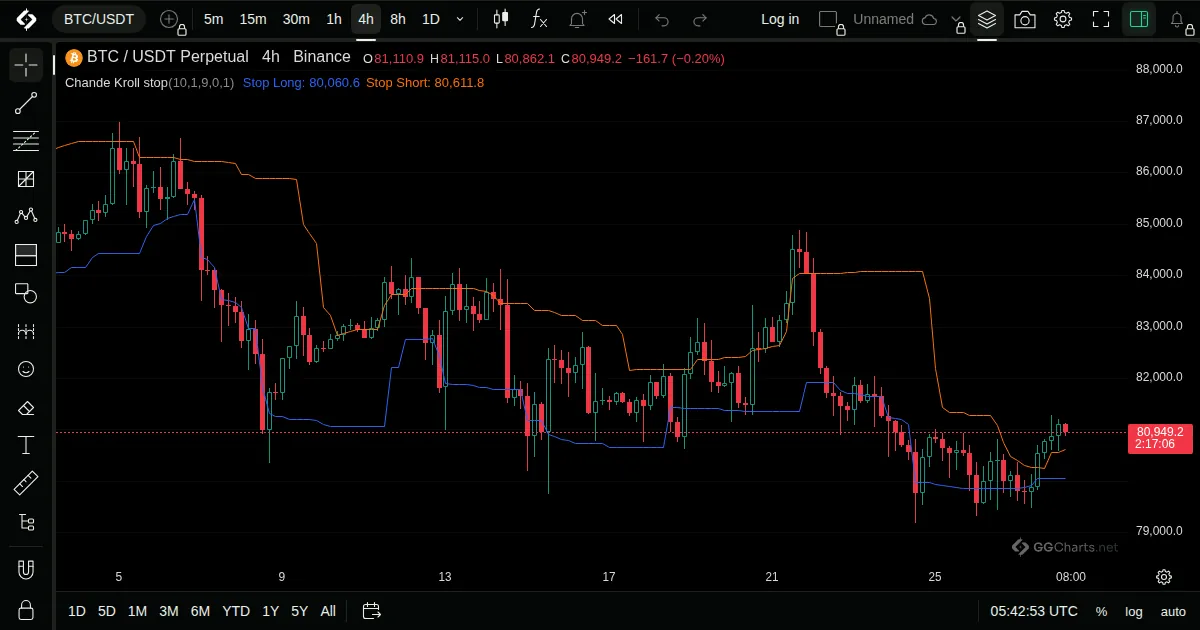
- What it shows
Two stop lines, one for long and one for short positions, that follow price at a distance based on its volatility.
- How it is built
Each bar's high and low are shifted by a multiple of the Average True Range, and the extreme of that over the stop length gives the line.
Default: ATR length 10, ATR coefficient 1, stop length 9.
- How traders read it
- The stop for longs below price rises with the trend.
- The stop for shorts above price falls with the trend.
- A close beyond a stop line is read as the trend ending.
- History
Presented in the book The New Technical Trader (1994).
Tushar Chande and Stanley Kroll, 1994
Related indicators
Volatility StopWilliams AlligatorKaufman's Adaptive Moving AverageMedian