Aroon
Trend
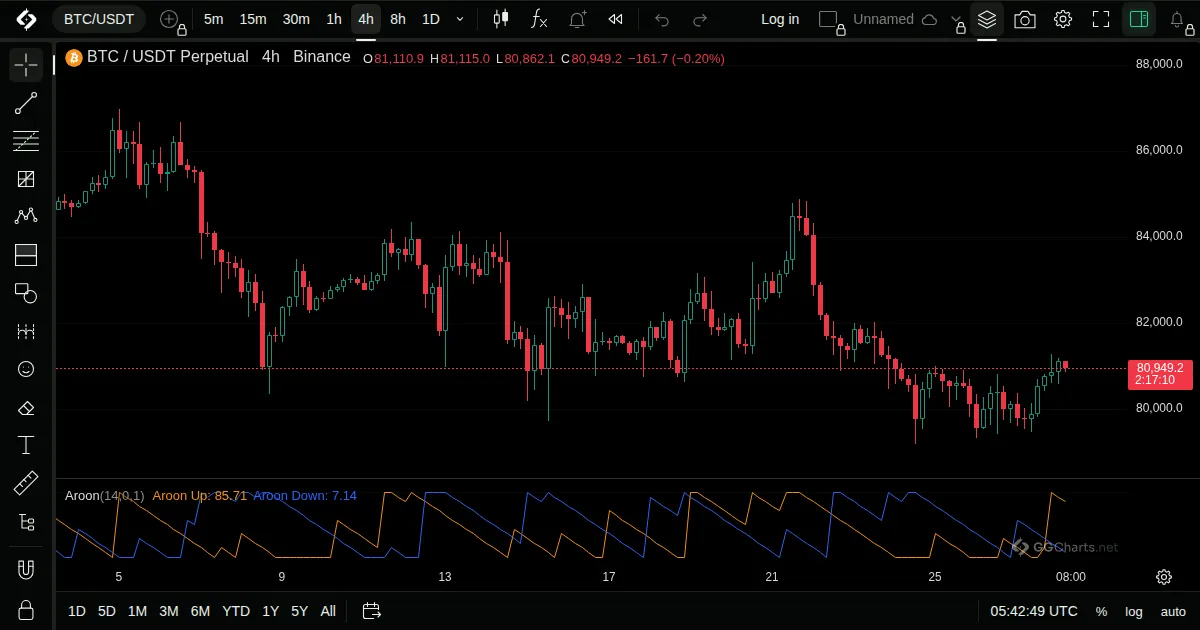
- What it shows
Two lines that show how recently price made its highest high and its lowest low in the period.
- How it is built
Aroon Up is the share of the period that has passed since the highest high, Aroon Down the same for the lowest low, both on a 0 to 100 scale.
Default: Length 14.
- How traders read it
- Aroon Up near 100 means a fresh high, an uptrend.
- Aroon Down near 100 means a fresh low, a downtrend.
- Both low and tangled suggests a range.
- History
Developed by Tushar Chande and introduced in 1995.
Tushar Chande, 1995
Related indicators
Williams FractalsVortex IndicatorChande Kroll StopVolatility Stop