Mass Index
Volatility
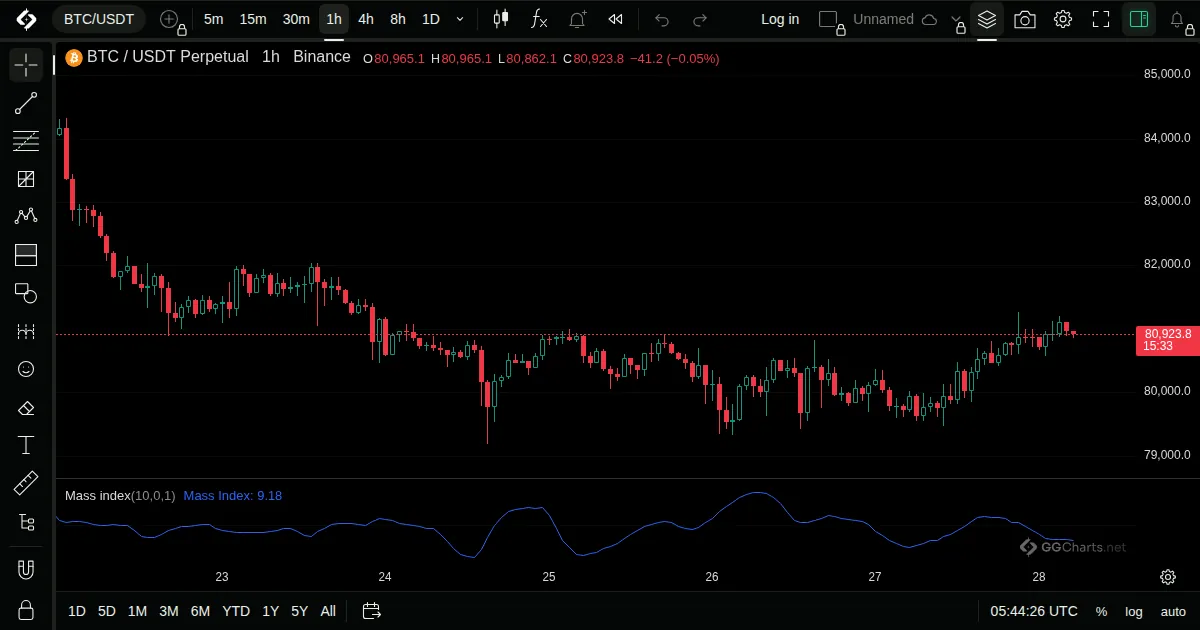
- What it shows
A line that watches the widening of the bar range to spot possible turns.
- How it is built
It sums the ratio of a smoothed bar range to a double-smoothed one over a number of bars.
Default: Length 10.
- How traders read it
- A rise above a high level and a fall back is called a reversal bulge.
- It does not give direction.
- Used as a warning of change.
- History
Introduced by Donald Dorsey in Technical Analysis of Stocks and Commodities magazine, June 1992.
Donald Dorsey, 1992
Related indicators
Relative Volatility IndexBollinger Bands %bBollinger BandWidthHistorical Volatility