Choppiness Index
Volatility
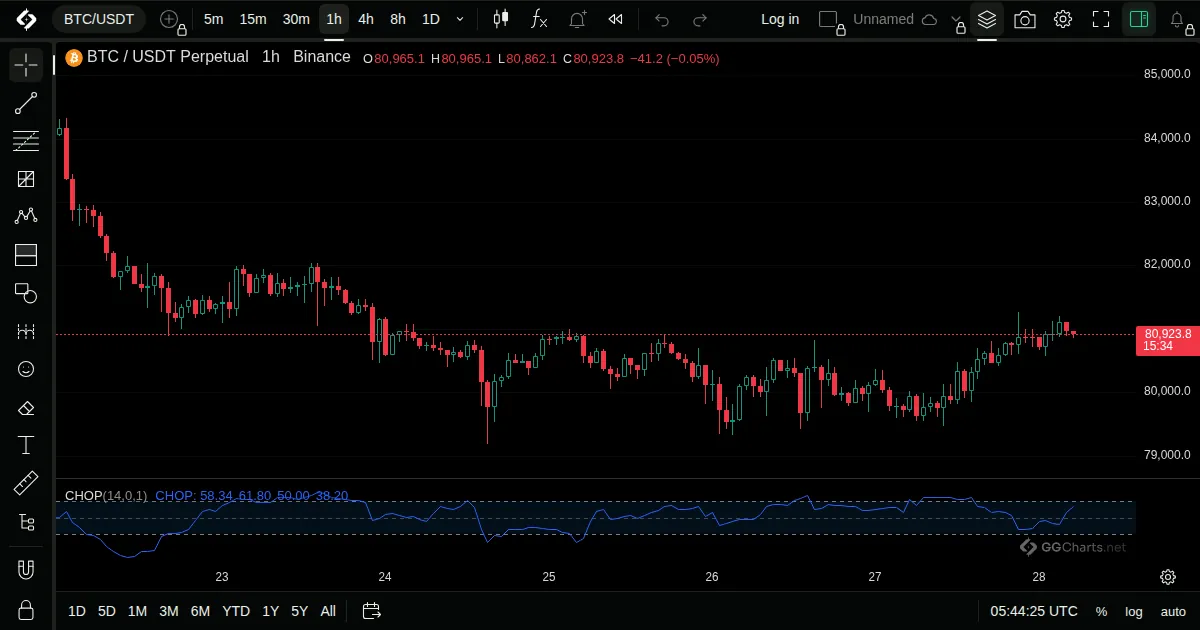
- What it shows
A line from 0 to 100 that says whether the market is choppy or trending.
- How it is built
It compares the sum of the true ranges over the period with the full high to low range of the period, on a logarithmic scale.
Default: Length 14.
- How traders read it
- High values, above about 61, are read as a choppy sideways market.
- Low values, below about 38, are read as a trend.
- It does not give direction.
Related indicators
Mass IndexRelative Volatility IndexBollinger Bands %bBollinger BandWidth