Bollinger BandWidth
Volatility, BBW
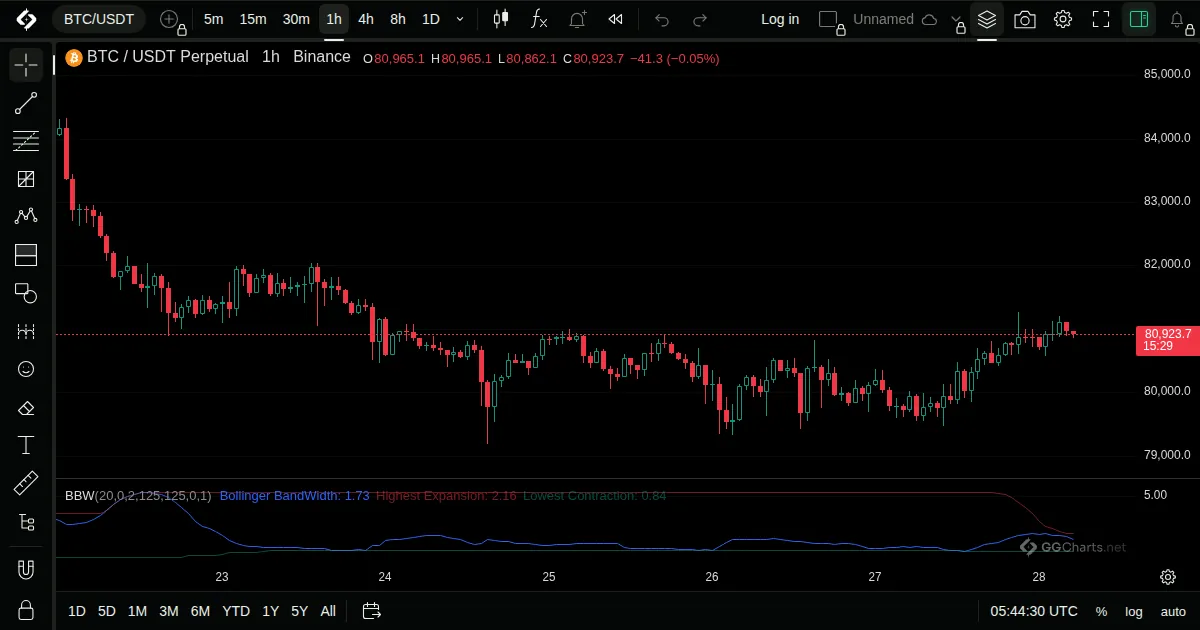
- What it shows
The width of the Bollinger Bands as a percent of their middle line, a direct reading of volatility.
- How it is built
The upper band minus the lower band, divided by the middle line. Lines for the highest and lowest values over a period are added.
Default: Length 20, 2 standard deviations, highest expansion 125, lowest contraction 125.
- How traders read it
- Low values show a squeeze, a quiet market.
- High values show an expanded, volatile one.
- The extreme lines help judge what is high or low for this market.
- History
Described by John Bollinger in his book Bollinger on Bollinger Bands (2001).
John Bollinger, 2001