Ulcer Index
Volatility
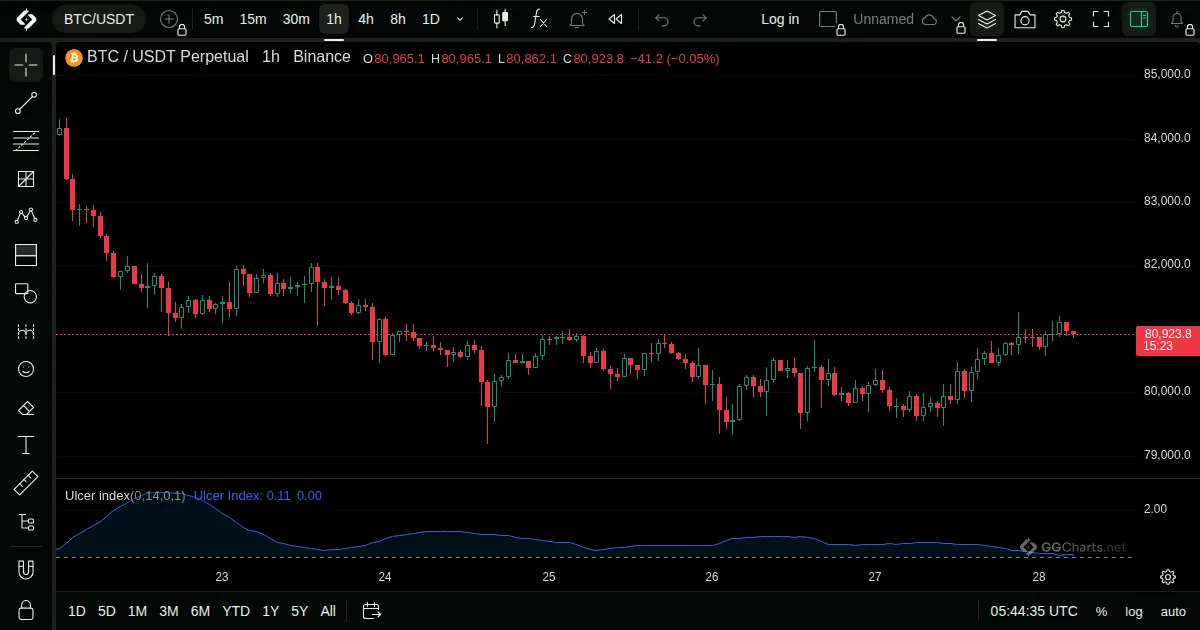
- What it shows
Measures downside risk: how deep and how long price has been below its recent high.
- How it is built
It is the square root of the average squared percent drop from the highest close of the period.
Default: Length 14, source close.
- How traders read it
- A high value shows deep or long drops from recent highs.
- A low value shows price staying near its highs.
- It only counts falls, not rises.
- History
Developed by Peter Martin and Byron McCann in the late 1980s.
Peter Martin and Byron McCann, late 1980s
Related indicators
Bollinger BarsAverage True RangeBollinger BandsKeltner Channels