Bollinger Bars
Volatility
- What it shows
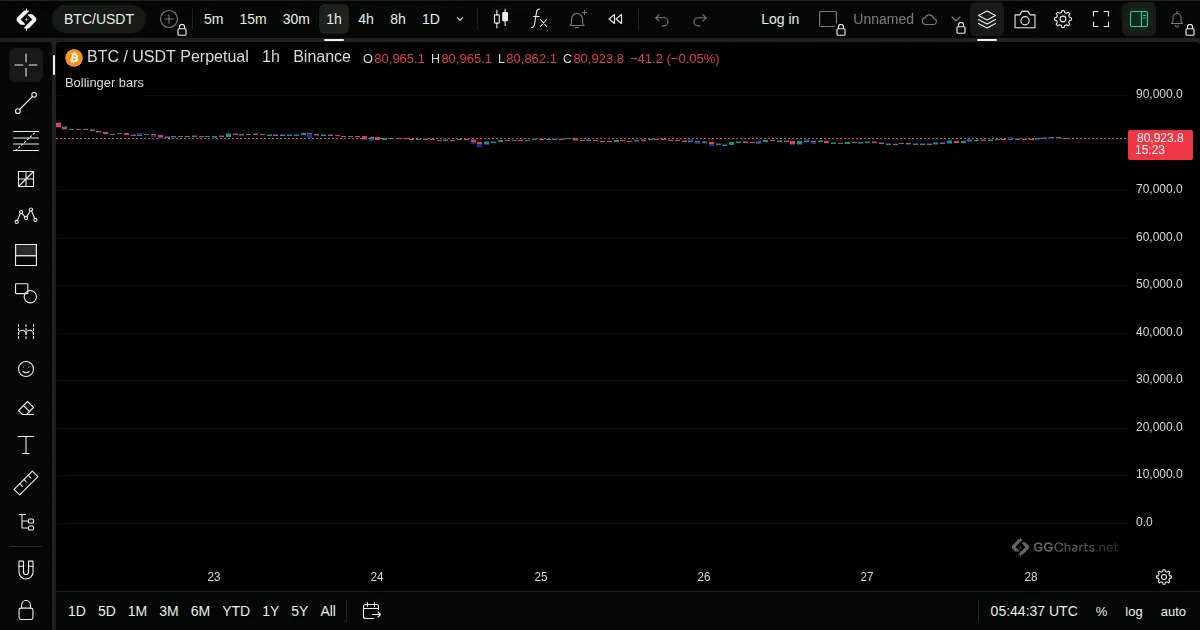
Colours the price bars by where they close relative to the Bollinger Bands.
- How it is built
Bars are coloured when the close is above the upper band or below the lower band.
Default: No inputs.
- How traders read it
- Shows bar by bar when price is outside the bands.
- Saves the extra pane of %b.
- Each colour shows which band was broken.
Related indicators
Average True RangeBollinger BandsKeltner ChannelsDonchian Channels