Keltner Channels
Volatility, KC
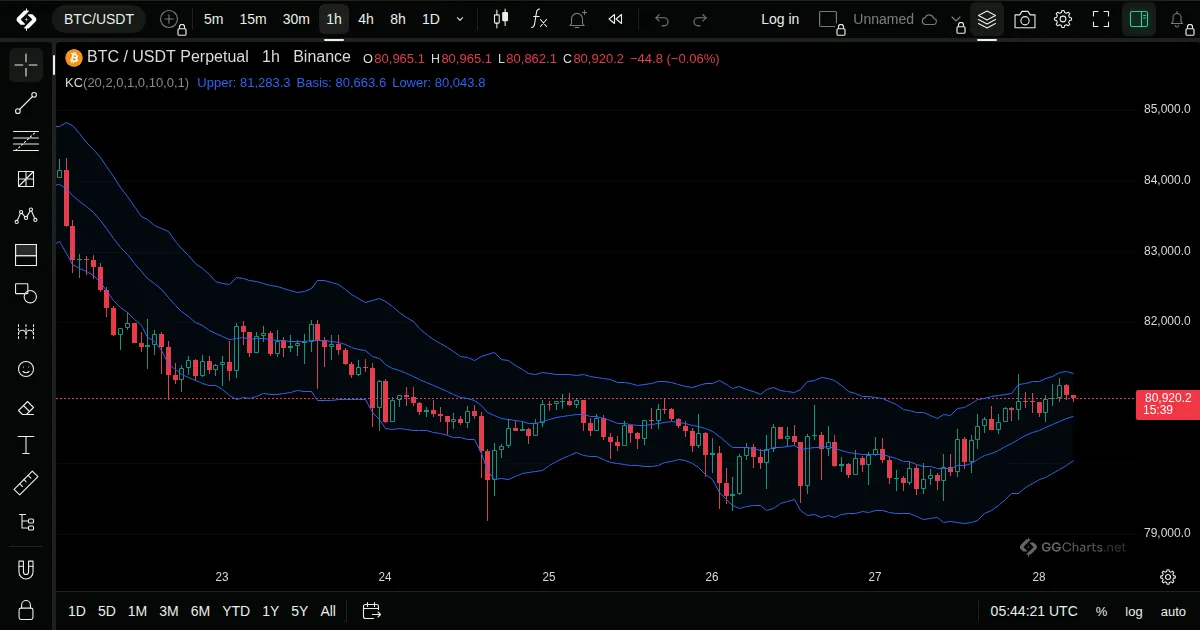
- What it shows
An average with a channel around it, whose width follows the Average True Range.
- How it is built
A moving average sets the middle line, and the bands are a multiple of the Average True Range above and below it.
Default: Length 20, multiplier 2, exponential average.
- How traders read it
- Price outside the channel shows a strong move.
- A channel that stays smooth is read as a steady trend.
- Compared with Bollinger Bands, it reacts more slowly to spikes.
- History
Introduced by Chester Keltner in his book How to Make Money in Commodities (1960). The version with the Average True Range came later.
Chester Keltner, 1960