Envelope
Volatility
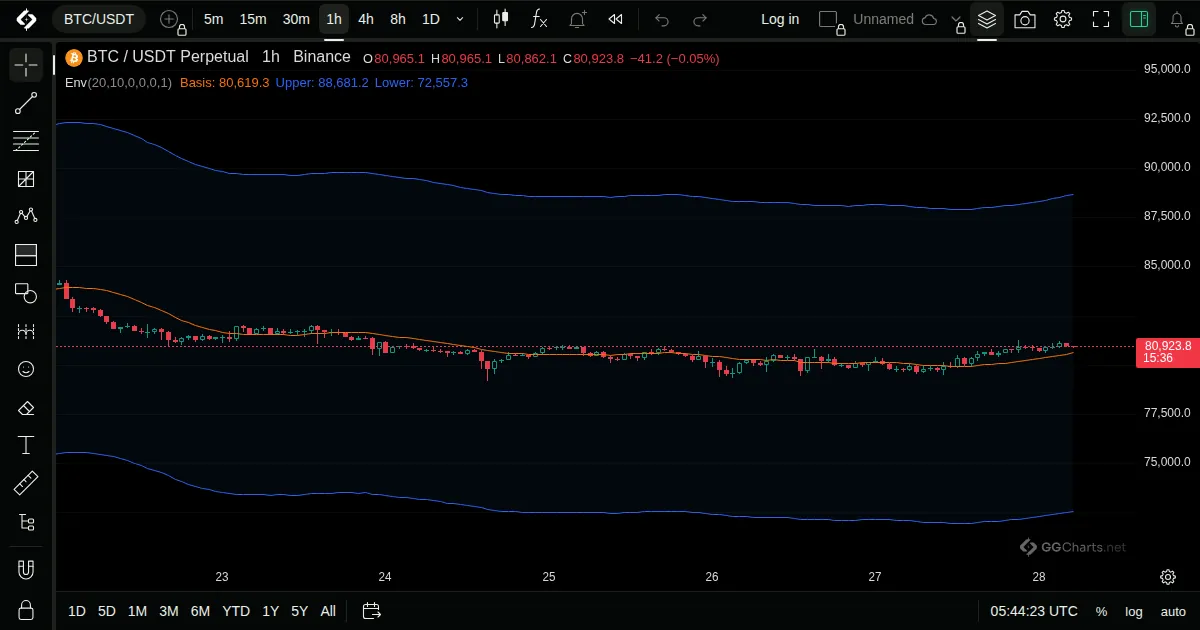
- What it shows
Two lines at a fixed percent above and below a moving average.
- How it is built
The middle line is a moving average, and the bands are shifted up and down by a set percent.
Default: Length 20, 10 percent, simple average of close.
- How traders read it
- Price near the upper line is stretched upward, near the lower line downward.
- Unlike Bollinger Bands, the width does not follow volatility.
- Pick a percent that fits how the coin moves.
Related indicators
Choppiness IndexMass IndexRelative Volatility IndexBollinger Bands %b