Bollinger Bands %b
Volatility, BB %b
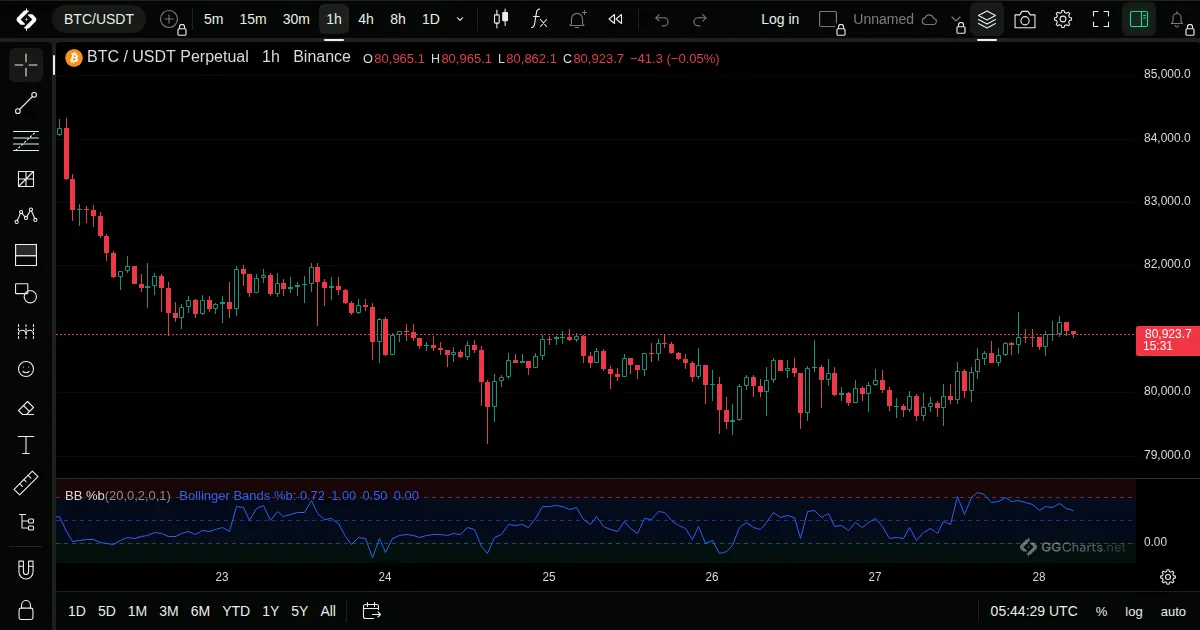
- What it shows
Shows where the price is relative to the Bollinger Bands: 1 at the upper band, 0 at the lower one.
- How it is built
It is the close minus the lower band, divided by the width of the bands.
Default: Length 20, 2 standard deviations, source close.
- How traders read it
- Above 1: price is above the upper band.
- Below 0: price is below the lower band.
- 0.5 is the middle line.
- History
Described by John Bollinger in his book Bollinger on Bollinger Bands (2001).
John Bollinger, 2001
Related indicators
Bollinger BandWidthHistorical VolatilityAverage Daily RangeBBTrend
Relative Volatility Index← All indicatorsBollinger BandWidth