Historical Volatility
Volatility, HV
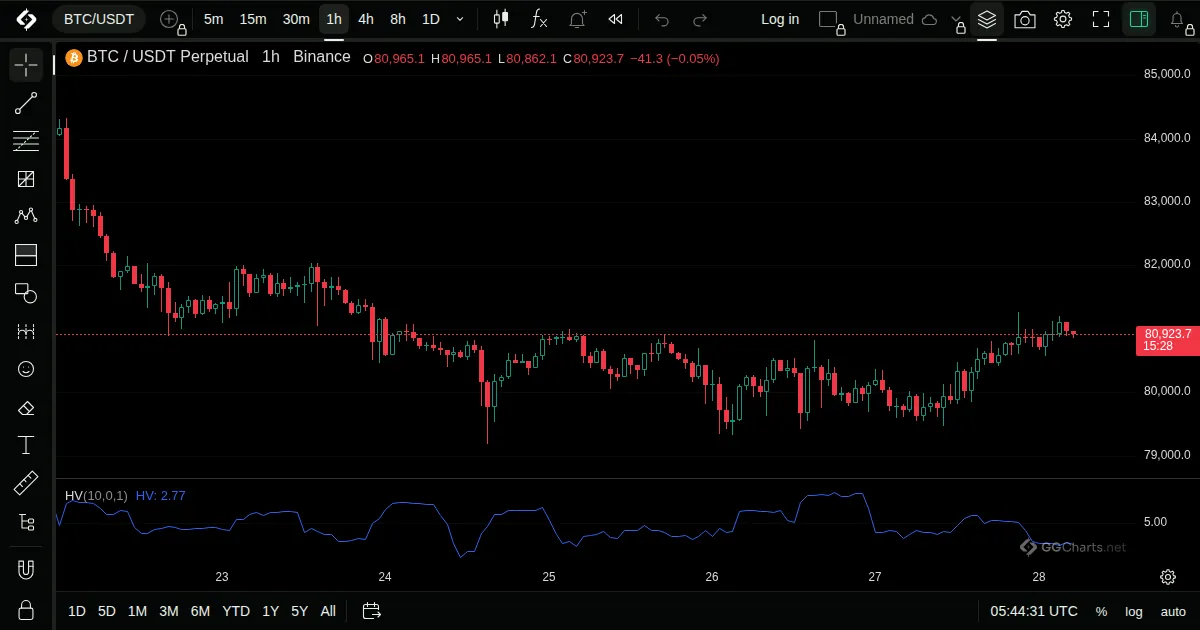
- What it shows
Shows how much the price has been moving, as an annualised percent.
- How it is built
It is the standard deviation of the logarithmic returns over the period, scaled to a year.
Default: Length 10.
- How traders read it
- High values mean a volatile market.
- Low values mean a quiet one.
- Volatility tends to return to its average after extremes.