Relative Volatility Index
Volatility, RVI
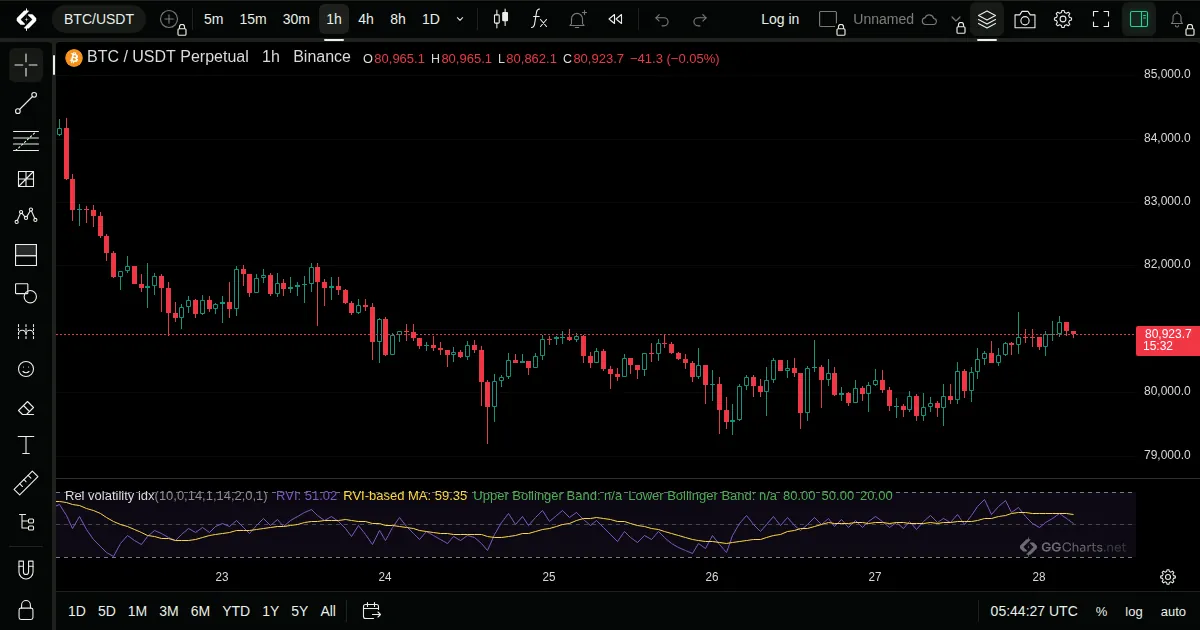
- What it shows
Like RSI, but made from the standard deviation of price instead of price change, so it measures the direction of volatility.
- How it is built
The standard deviation of the last bars is smoothed separately for up bars and down bars, and set against each other on a 0 to 100 scale.
Default: Length 10, EMA length 14, source close.
- How traders read it
- Above 50: volatility is rising on up moves.
- Below 50: volatility is rising on down moves.
- Often used as a filter with a trend indicator.
- History
Introduced by Donald Dorsey in Technical Analysis of Stocks and Commodities magazine in 1993.
Donald Dorsey, 1993
Related indicators
Bollinger Bands %bBollinger BandWidthHistorical VolatilityAverage Daily Range