Average True Range
Volatility, ATR
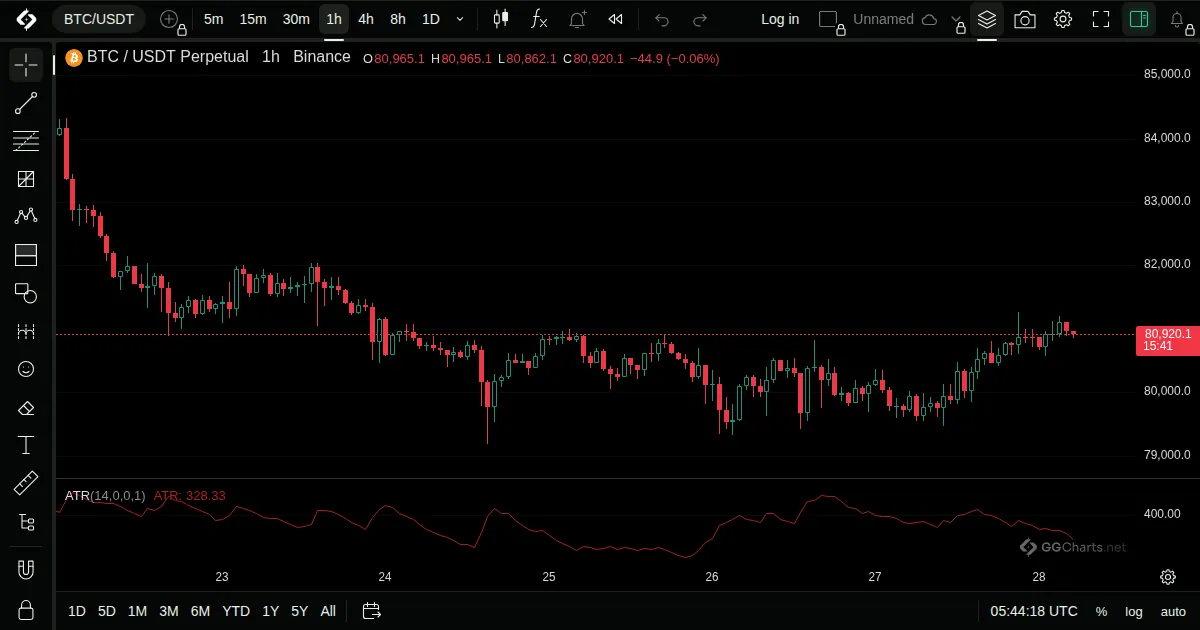
- What it shows
A line that measures how much price typically moves in one bar, including gaps. It says nothing about direction.
- How it is built
Each bar's true range is the largest of its own range and its distance from the previous close. ATR is a smoothed average of it.
Default: Length 14, RMA smoothing.
- How traders read it
- A high value means a volatile market, a low value a quiet one.
- Often used to set stop distances and position size.
- Rises in sharp moves and falls in calm ones.
- History
Introduced in his book New Concepts in Technical Trading Systems (1978).
J. Welles Wilder Jr., 1978