Percentage Volume Oscillator
Volume, PVO
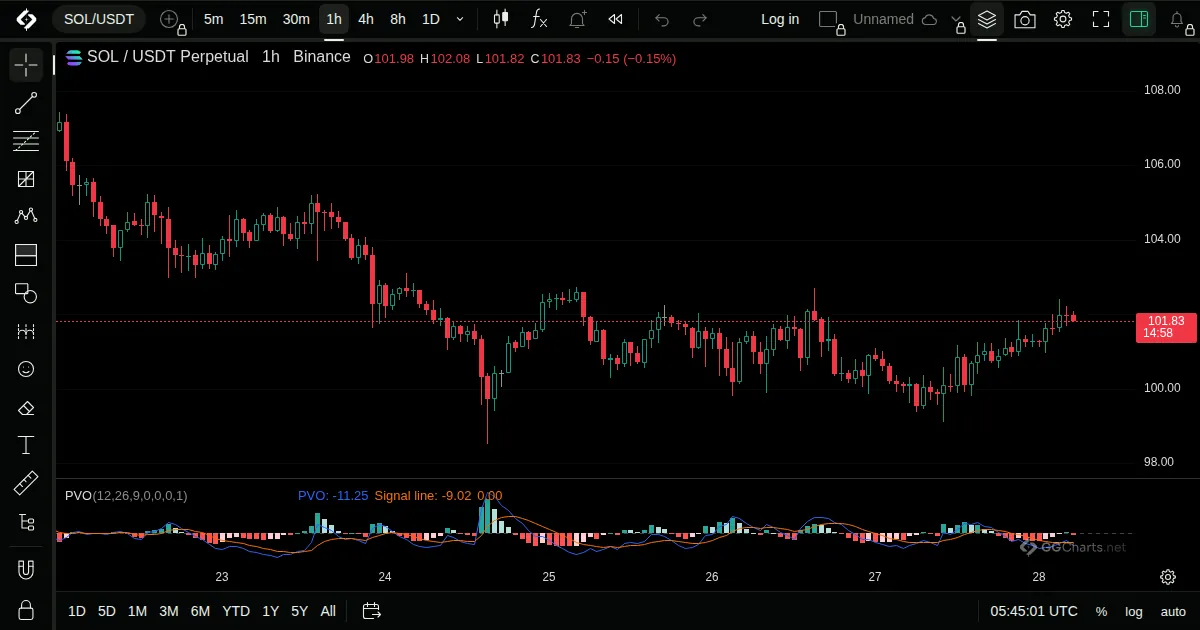
- What it shows
MACD for volume: the gap between a fast and a slow average of volume, as a percent.
- How it is built
Fast volume EMA minus slow volume EMA, divided by the slow one, with a signal line and histogram.
Default: Fast 12, slow 26, signal 9.
- How traders read it
- Above zero: volume is above its long average.
- Rising values show growing activity.
- It shows participation, not direction.
Related indicators
Negative Volume IndexPositive Volume IndexRelative Volume at TimeVolume