Relative Volume at Time
Volume, Rel vol
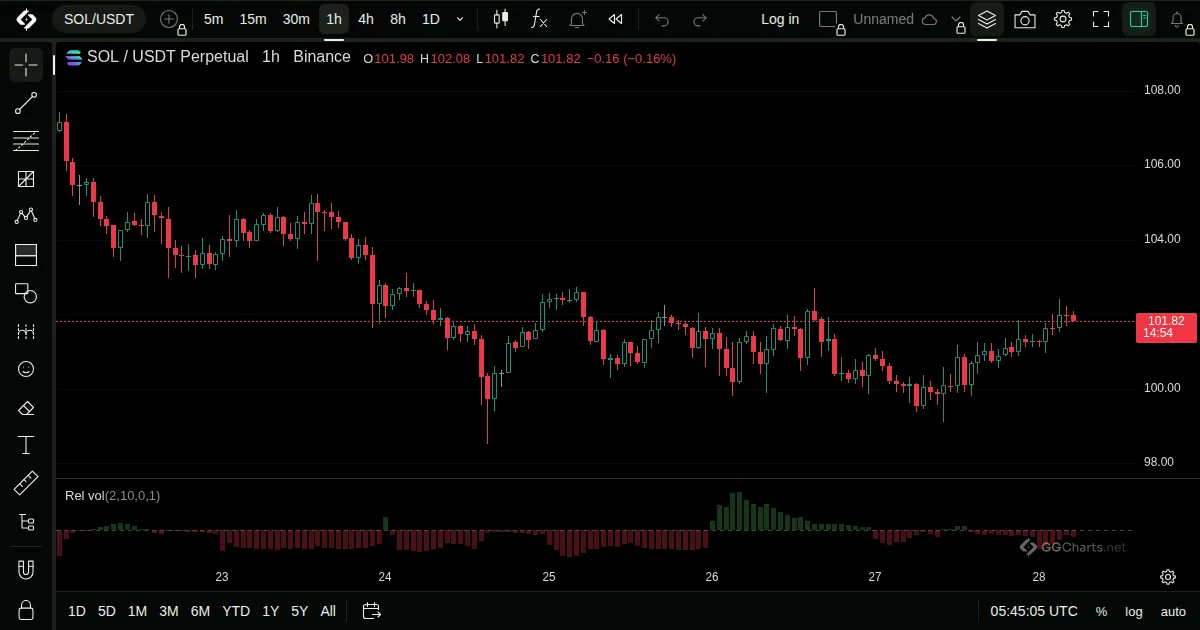
- What it shows
Compares the volume of the current bar with the volume of the same time in earlier periods.
- How it is built
Volume of each bar is divided by the average volume at the same point of the earlier periods, such as the same hour of past days.
Default: Anchor timeframe 1 day.
- How traders read it
- Above 1: more volume than usual for this time.
- Below 1: quieter than usual.
- Useful to spot unusual activity.