Volume
Volume
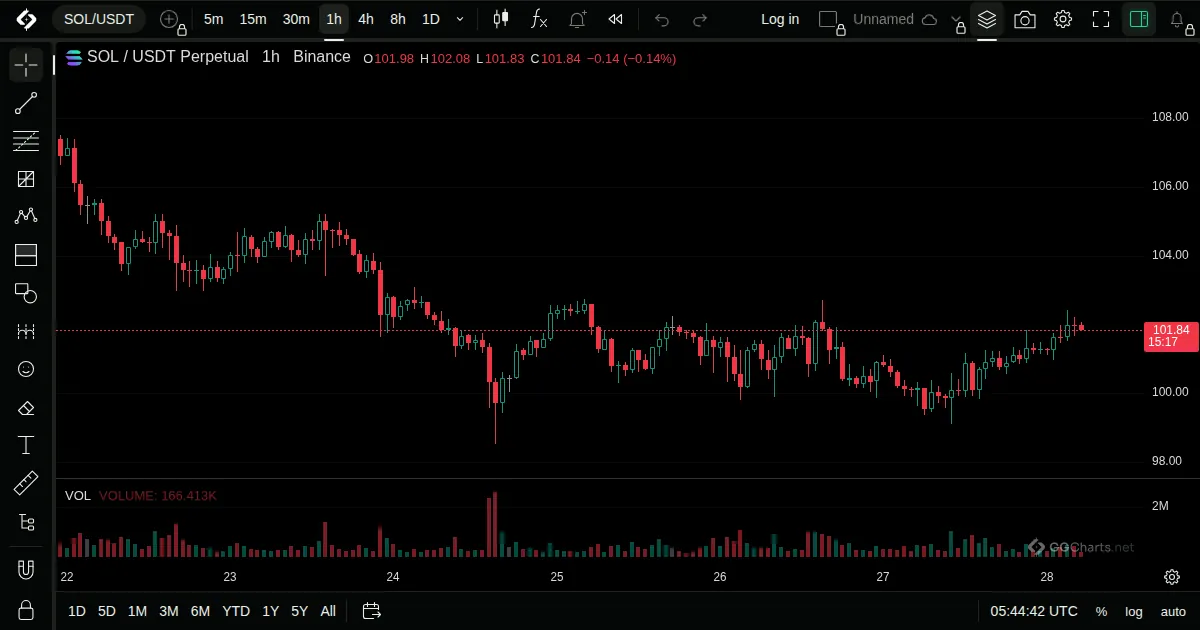
- What it shows
Bars under the chart that show how much was traded in each bar.
- How it is built
Each bar of the volume pane is the traded amount of that candle, coloured by its direction.
Default: No inputs.
- How traders read it
- Rising volume in a move shows interest behind it.
- A move on low volume is read as less reliable.
- Spikes often come at turns or news.
Related indicators
VWAPVolume Weighted Moving AverageOn Balance VolumePrice Volume Trend