VWAP
Volume
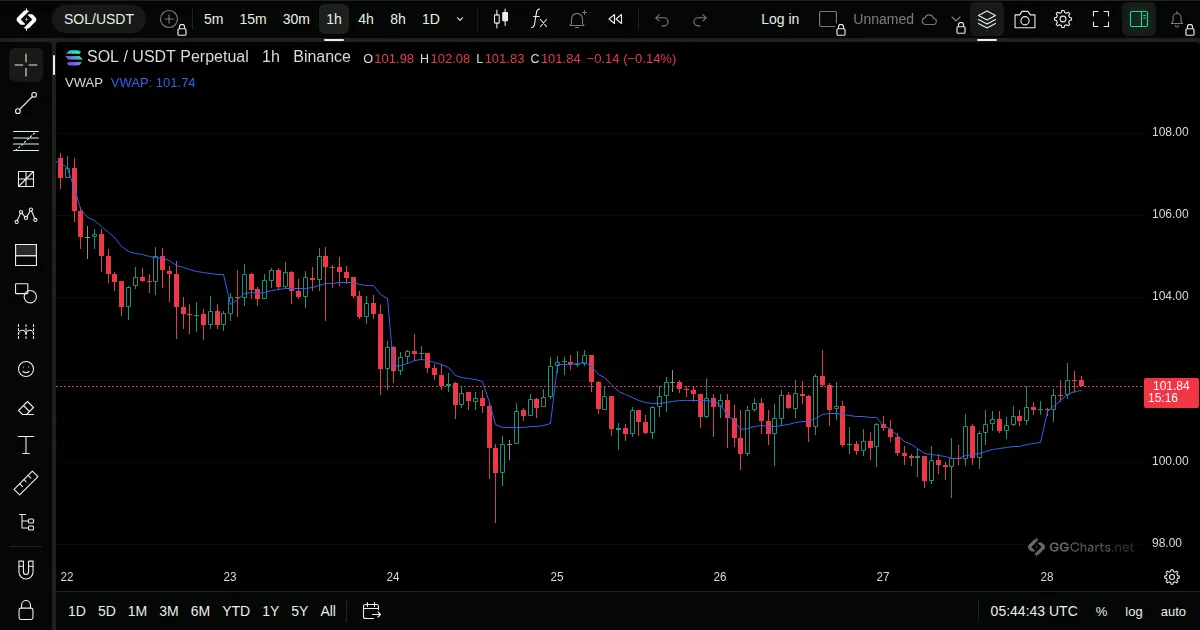
- What it shows
The average price of the day weighted by volume, drawn on the chart. It shows the price at which most trading happened.
- How it is built
The sum of price times volume divided by the sum of volume, restarted at the beginning of each period.
Default: Anchor 1 day.
- How traders read it
- Price above VWAP shows buyers are in control for the day.
- Price below it shows sellers.
- Often used as a fair price and as support or resistance.
Related indicators
Volume Weighted Moving AverageOn Balance VolumePrice Volume TrendEase of Movement